How to compare historical draft rankings?
Draft Rank Value (DRV) - A new metric to objectively compare draft rankings
Our new analytics draft board tool has gotten a lot of great feedback and I suggest you check it out if you haven't already. Upon seeing results from the handful of different analytical models, it makes you ask the question: How good are these models anyway? As the creator of one of these draft models, this is a question I have frequently asked of my own model. One subjective method for answering that question might be to eyeball out of sample results for well known draft stars/busts. However as an "analytics guy" I know we can do a lot better.
Instead there should be an objective way to quantify just how good a model has done historically. Having an objective method would allow us to compare the models amongst each other and more importantly against non-analytics based methods such NBA team selections and analysts rankings1. This would allow us to see just how much these models should be trusted.
How to measure player success?
Before coming up with a way to compare models, one must first define what "success" for an individual draft pick means. Nowadays there are a plethora of single number metrics to rate players (RPM, SPM, WS , PER, BPM, VORP). Discussing the tradeoffs between them is worthy of a post of its own so I won't dive into that. In this post I will assume that there is a well agreed upon one number metric for comparing the success of different players. In my examples here I will be using Peak RPM as that well agreed upon success metric.
Is ranking sufficient?
If players drafted in a particular year were sorted by Peak RPM, this would produce one opinion of an optimal draft ranking. Using that ranking, a simple approach to compare historical draft rankings might be to calculate the root mean squared error (RMSE) between the optimal ranking and out of sample historical rankings. Here is an example of this:
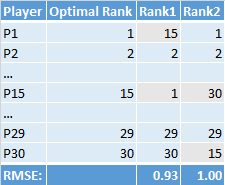 In this example, both Rank1 and Rank2 matched Optimal Rank except for a single miss (not realistic but using to prove a point). Rank1 missed on a selection by 14 slots whereas Rank2 missed by 15 slots. If you calculated RMSE for both of these rankings the value would be slightly worse for Rank22. However does this mean that Rank1 is a better ranking? Let's add Peak RPM to the same chart and see what it shows:
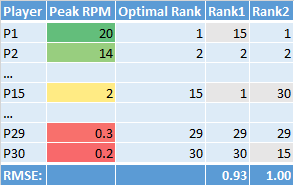 From this chart we see that the miss by Rank1 is much more important than the miss by Rank2. It is apparent that our simple method is not taking into account the differences in value between the players in a draft class - not all ranking misses are equivalent.
What is important?
How about we define what is important to us in a historical draft ranking comparison method. Here are the requirements I came up with:
- Rankings should be punished for overvaluing players
- Rankings should be punished for undervaluing players
- Rankings should be punished relative to player value - undervaluing Chris Paul is much worse than undervaluing Luke Ridnour
Methodology
With a slight change to the simple method above we might be able to meet all of the defined requirements. Instead of calculating RMSE on the actual vs. expected draft slot ranks, we can instead transform the draft slot ranks into an expected player "success" value and calculate RMSE on that. This is best shown with an example:
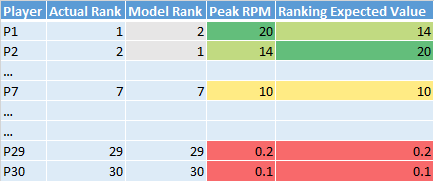 If you can't tell from the example Ranking Expected Value is is calculated using the following formula:
Ranking Expected ValueP(i) = ActualRank[ModelRankP(i)] -> PeakRPM
This calculation can be done for all of the different players for a given ranking/year. Then we can calculate the RMSE between actual (Peak RPM) and expected (Ranking Expected Value) to come up with a total RMSE value for each ranking/year. An example of this is shown below:
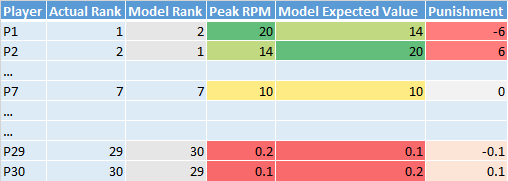
Let's see if this methodology fulfills all of our requirements:
- Overvalue - The ranking is punished for overvaluing P2 and P30
- Undervalue - The ranking is punished for overvaluing P1 and P29
- Player Value Based Punishments - The punishments for P1 and P2 are more severe than that of P29 and P30
While there are many possible methods to compare historical draft rankings objectively3, this method seems suitable given our defined criteria. However if only looking at RMSE values there are some drawbacks4:
- A higher value actually means a worse model which isn't always intuitive to people.
- The values aren't necessarily comparable across years since different years will have different Peak RPM ranges.
Draft Rank Value (DRV)
Before I share how to calculate our final metric (which is a slightly modified RMSE value), let me first define another value which will be used in its calculation:
RMSEWorst is defined as the RMSE value for the worst possible ranking for a given year (optimal ranking reversed)
Using RMSEWorst we are able to calculate a metric called "Draft Rank Value" (DRV). This metric is standardized meaning it will produce values between 0 and 100 (with the optimal ranking having a value of 100). It can also be compared across years regardless of draft class strength. The value is calculated using the following formula:
DRV = 100*(1-(RMSERanking/RMSEWorst))
Now revisting our original question: How good are these models anyway?
Are they better than random? Better than NBA GMs? Better than Chad Ford? Using DRV we should be answer these questions objectively.
Coming soon will be a new tool here at tothemean which will allow you to answer these questions yourself.
-
While models typically produce relative weightings for players, analyst rankings do not. Therefore we are looking for a method which uses rankings and not weighted values. This aligns with how models might be used in the draft. Teams only get to choose a single player, so it doesn't matter if they think two players are really close in value, in the end they only get to choose one player. ↩
-
Remember that RMSE represents the error amount so a lower value generally means a better model ↩
-
We would love to hear from you if you have better ideas! ↩
-
There are other drawbacks of this method, one which comes to mind is how much the distribution of your "success" metric can influence the values. There are likely other drawbacks as well but we'll leave that to our readers to comment on. ↩