Using machine learning to predict the long-term value of NBA draftees
Background
Recently I found out about the Sacramento Kings Draft 3.0 challenge. Unfortunately I heard about it only 2 days before submissions were due. Using data to influence draft decisions is a topic I have thought about previously so I had no shortage of ideas to explore. Over the next two nights I spent every free minute I had scrambling to put something together for the contest, however I was so rushed that I wasn't able to do much more than get data in a usable format and build a simple model. After I submitted my hurried analysis I have been able to better analyze results, add new data, improve data quality, and enhance my model. Now I would like to share some of my observations and results.
Introduction
In the Draft 3.0 contest the main goal was to evaluate the long-term value of potential NBA draftees. The scope was limited to players who are being drafted from college which eliminates high school and overseas players (and a lot of complexity from not having consistent data!). In my ongoing research I have maintained this same level of scope mostly because it is much easier to get data on college players, however in theory it should be very feasible to apply the concepts of what I have done to international and high school players in similar ways. This analysis will be focusing on how I used machine learning (ML) to predict long-term value for NBA draftees and then analyze how this compares with the order in which NBA teams draft players. I have seen some prior research related to predicting draftee performance such as here and here - however all of the analysis I have found online pretty much only use regression and not any other advanced machine learning techniques. I want to explore if any particular ML techniques beyond regression can help build a reliable model to base draft decisions on.
Data sources
My dataset consisted of all players who were drafted since 1991. For each player I included a ton of different attributes taken from the following sources:
- Pre Draft Measurements (they have data from years: 1987, 1989, and 1991 onwards) - Throughout the rest of this post I will refer to this data as "combine" data.
- College Player Individual Stats - I used most all of the "Per 40 Minutes" and "Advanced" sections
- College Team's statistics - I used most all of the basic school stats as well as the advanced school stats. This included SRS/SOS to account for quality of opposition and pace which should help with team playing style differences.
- NBA Draft Results
Data source notes
- I only went back to 1991 because combine data only consistently went back that far.
- I filtered out a handful of data from training my models including:
- Draftees from 2013 since it is still too early to tell results for most of these players. I could probably make the same case for 2012 but it seemed to help the model so I kept it.
- Players who didn't have a season in college - note that I didn't filter this for the few models which were purely based on combine data.
- Partial data - players with less than 15 games played or less than 100 minutes total in a college season as they aren’t reliable indicators due to lack of playing time or injuries.
- Data errors - there were a couple of players who seemed to have errors in their college stats - one guy somehow shot 3000% in two pointers one year!
- I included the draft position the player was actually picked, ideally I would have used draft rankings which can be known before the draft but I couldn't find any going back further than 2001. I think that when predicting 2014 and onward I should be able to use mock draft rankings in place of this and I don't expect it to have an impact as the rankings usually align with actual draft picks fairly closely. My next blog post will be breaking down the 2014 draftees and for this I will use expert mock draft data in place of actual draft pick.
How to measure "long-term value"
Deciding how to measure long-term value of an NBA player is worthy of a whole conversation on its own. I explored a ton of different ways and all seemed to have their own drawbacks. Here were the two main themes I was struggling with:
- Stats which are cumulative such as win shares (WS) aren't comparable across draft classes
- The number of seasons a player has played greatly affects win shares. You can't compare a player who has played 11 seasons with a guy who has played 6 or else you will think Matt Harpring (41.9 WS) is comparable to Russell Westbrook (42.3 WS)
- Stats which are normalized per minute such as win shares per 48 (WS/48) don't take into account length of career or playing time
- Win shares per 48 is meant to normalize production across 48 minutes try to handle the problems brought up in #1. However after I started looking at some data I found that some fairly mediocre players were showing up at the top of the list next to stars. For example Brandan Wright looks like a god in this metric, he has a WS/48 value of .178 which is higher than Westbrook with .136 and on par with Kevin Love who has a value of .189. Throughout this I noticed that advanced stats seem to really like Brandan Wright. However should I be building a model which tries to optimize for a player like Wright who averages only 15.6 minutes per game? Similarly Greg Oden has a value of .174. I don't think any NBA team would want a model telling them to draft a player like Greg Oden! Therefore I found this metric to be misleading for guys who don't have a lot of minutes. It doesn't punish players enough who have short careers, are injury prone, or don't see the floor more than cleanup time.
I also considered some of the following techniques but I didn't pursue them further because of the drawbacks I mention:
- Zero out a players win shares per 48 if the player doesn't meet minutes/games threshold for a season - the threshold would be arbitrary and partial success shouldn't look the same as never actually playing
- Rank in draft class ordered by something like win shares - This would make Carmelo look like a 4th best player when pretty much any other year he would be top 2 so it doesn't represent actual value very well. Also at the bottom of the draft board a guy with .1 WS might look 20 points higher than a guy who never played when in reality they are both equally bad.
- Use highest WS ever achieved in a season - this would wrongly not punish one hit wonders who have short careers (Pervis Ellison or Dana Barros anyone?). Also players who have only been in the league 2 or 3 years might not have hit their peak yet so they aren't too comparable with veterans.
- Use average WS per season in the league - Guys who played a few years longer than they should have would be punished when in fact they should be rewarded for showing good longevity.
- Sum WS from top/first X seasons - Would need to throw away data for all guys who haven't played X+ seasons which would hurt the model.
- Use WS from their Xth year in the league - What if the player didn't have a good year that year but did every other year? In the end I was inspired by this research to measure value relative to other players who were from the same draft class. As you can see in that analysis they calculated the relative value of each player compared to the top draft choice of their draft. I modified this slightly because some top value players from each draft are better than others and I could see it punishing the players who are being compared with them. Therefore the measurement I settled on was to take the sum of value from the whole draft class and then take a players relative proportion of that total value from the draft class. This also made the values of players be a little more smooth compared to the percent value of the top valued pick. Using this technique makes it possible to compare retired players, veteran players, along with up and coming players because they are all being compared relative to their own draft class. It also properly shows the true value of a player across his whole career (for older and retired players) allowing me to somewhat take into account longevity in the model.
Note that I did see a few minor drawbacks of this method such as:
- The "longevity" aspect isn't taken into account for players from more recent draft years.
- The strength of a draft class does impact value - David West has a solid WS value but when comparing him with the rest of the 2003 draftees he doesn't look as good.
- Late bloomers/short careers won't show up for more recent drafts years. Regardless, this was the best method I could come up with - let me know if you have any better ideas and I can try them out.
Now that I decided on a method the only remaining was to pick what statistic measure against. I considered the following:
- WS
- PER*MinutesPlayed - (PER)
- Traditional "fantasy" stats based formula - 1*PTS+2*AST…etc
- Average of multiple of these
All of these would suffice and they generally give similar results but currently I am using the PER based metric as it seems to give slightly more reliable results in terms of favoring guys who I would consider to be the best.
Here is a diagram showing the top 25 players from my training data using this measurement of success:
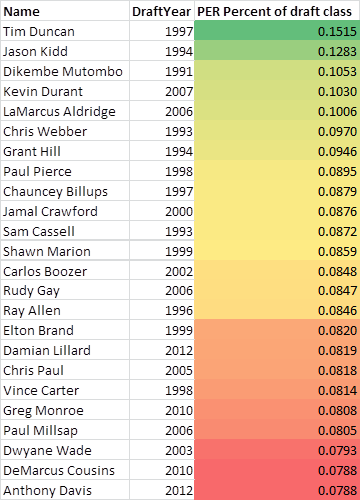
As you can see from the list it does a pretty good job of measuring success combined with longevity. You can't argue with many names on this list especially with Tim Duncan on top of the list. There are a handful of players who show up from having more extended careers compared to the rest of their draft class but all or close to all of these have been all stars at some point in their career. Note that this only includes guys who played in college which is why you don't see LeBron, Dirk, etc.
Methodology
To build models which predict long-term draftee potential I took all of the data I could find and ran it through several different ML algorithms. Before I get into more details on this I need to quickly go over how I structured my data. Initially I was only using a players most recent season of college statistics. However I realized I was throwing away a lot of valuable data not only for training but also for predicting. You only have so many training samples of players who leave after their sophomore year but there is a lot of data on players sophomore year stats who end up staying another year or two and then go on to the pros. In addition, players can sometimes stay an extra year in college and hurt their draft stock - Willie Warren and James White for example. So only taking into account one season's worth of data might not be show a players full potential. For both of these reasons I saw a lot of value in using this data all years of a college players career rather than just the most recent. To achieve this I created a different training sample for each year of a players college career. Each year of college would have different player and team based statistics. (Side note: I did re-use their combine stats for all years which may not be fully accurate since they might not have jumped as high as a sophomore as they did as a senior). This allowed you to have more training examples for how freshman/sophomore stats translate to the NBA as well as give multiple predictions for a particular player.
Now let me go over how I generated models, gathered predictions, and measured performance. When building models and generating predictions to measure the models against I used cross validation. In cross validation you need to split up the data into "chunks" and hold out this data from actually training a model and then you can use that data to validate performance. I chose to split it up into chunks based on draft year. This means that I built 22 different models (1991-2012) for each ML algorithm and then I took the predictions on the held out data. At this point I had an unbiased prediction for each draftee since 1991 and this is what I used to measure performance against. For regression type of ML classifiers the predictions were in the form of a number which represented percentage of draft class value. For classification type of classifiers I the prediction is not of their actual value but instead is in the form of a confidence measure that a player will be in the upper half of his draft class. I will provide some more details on this below when I talk about each of the ML algorithms I tried.
Each player would potentially have multiple predictions depending on how many years they player played in college. For these cases I explored averaging the rankings as well as taking the maximum - I will touch on this more in the results section.
Now that I have all of these predictions for each player from each algorithm I needed a way to compare with NBA teams actual draft performance. There are a lot of ways you can achieve some level of this, however the way I chose was to take the ranking from the algorithms predictions for each year to simulate what order the algorithm would have drafted players in (ignoring team needs, etc). Similarly I have the equivalent predictions from the NBA teams (from the players actual draft pick number). To measure performance between the two I took the correlation between the "success metric" which represents long-term player value (this is the PER based metrics as described above) and the actual player success metrics with both of these "predictions". Correlation values were calculated via the "Pearson Product-Moment Correlation Coefficient". Whatever had a higher correlation with the players actual long-term value is what I am considering to be a better predictor.
Data observations
Most Machine Learning algorithms offer little insight into what attributes contribute to their performance as they are a black box in a sense. However during this process I did find ways to get a feel for what attributes contribute the most towards model performance. Here are some of my observations on the attributes which seemed to help the models most (or surprisingly didn't help at all):
- Adding college position or NBA position seemed to hurt my models more than help so I didn't include either of those. Most players nowadays are a blend of a couple of positions so the classifications don't mean as much. This research paper shows that there are in fact 13 different positions and not just 5 so it might be that the traditional positions are outdated. Playing styles can be learned through their statistics just as easily which is one reason why I don't think it is very relevant in generating a model.
- I included the age of the player in what would be his first year in the NBA as well as number of seasons played in college. Both were very significant in terms of negative correlation with success. From what I can tell age might be a slightly better indicator but I think they both have the same effect on the models. This correlation aligns with other studies I have seen and it makes sense because the best players go pro earlier than later.
- Including all years worth from college as opposed to just a players final season was very important for improving predictions as it added a lot more training examples.
- Since I included all years of a college career this allowed me to get multiple predictions for each player based on if he left early at any point in his career. Initially I thought that just taking the average of his predictions would probably make the most sense. However this didn't turn out to be true and the most reliable method was taking the max from their career. I am guessing this is because some players who stuck around for 4 years might not have gotten a lot of playing time in the first couple of seasons and those numbers weren't accurate of their potential (even though I did include 40 minutes normalized stats). Also some players show a lot of growth throughout their career so their potential increases by the time they are a senior and these earlier seasons predictions would hurt them. In a future blog post I plan to explore how their expected long-term value changes over the course of their college career.
- In models where I included a players draft pick number it was always the most significant variable. You can see this in the results being so much lower in performance when I didn't include it. I will go over what this means in the conclusions.
-
In general I found that when you try to pull out the most important predictors of success it matters a lot about which data you are considering. When you only look at combine data on its own the predictors are much different than when you include box score/advanced statistics. For example, steals correlate a lot with max vertical so depending on if you are looking at combine vs regulars stats vs both combined you will get different results on what is most important. Another example of this can be seen when you add in the players actual draft pick number - with it the remaining important attributes will essentially be what NBA teams are not properly considering since the players overall value is pretty well measured by their draft pick number. Whereas when draft pick number isn't included, all the things which correlate with NBA draft pick will show up (I will be revisiting this in a future blog post). The reasons for this are mostly because a lot of the attributes have high correlation with each other.
- If you don't include draft pick but consider everything else the most valuable indicators as shown by regression models were:
- win shares per 40 from college - this makes sense since it pretty well represents a players overall value on both ends of the court
- steal percentage - steals seem to have high correlation with NBA success - they represent a lot of things like athleticism, speed, and basketball IQ
- offensive win shares from college - this represents offensive value which is obviously valuable in the NBA
- age - as I mentioned above it had a high negative correlation
- hand length - This is a very interesting one in that it had a negative correlation when combined with these other attributes. That would make sense to me if I had included draft pick (which would mean that NBA teams might be overvaluing this) but that wasn't the case here. When I look at the raw data I see there are players with some of the smaller hand lengths who are very talented (Kemba Walker, Isaiah Thomas, Michael Carter-Williams) whereas the guys with the biggest hands are big men who haven't proven themselves (Olu Ashaolu, Greg Smith) which could explain this. Note that Kawhi the "KingSlayer" Leonard actually has very large hand width and more average hand length. This all bodes well for a lot of 2014 draftees including Kyle Anderson who has smaller hand length especially for his height. However one question which might be worth exploring is if this still has a negative correlation when you consider a player's height? For example it might not matter when you are above a certain height if you have smaller hands but it might really help for short guards? Also this could just be the fact that there isn't a lot of data on this measurement yet - Rondo who is known for large hands doesn't show up with draft measurements so he isn't factoring into this.
- team advanced stats for FT attempt rate (negative correlation), percentage of shots from 3 (negative correlation), FT per FG (positive correlation) - It is hard to comprehend what this exact combination of team advanced really means but I'll try to come up with some sort of explanation. The first and third sort of cancel each other out since one is saying that the team takes more FT's (compared to FG) and the other less. The second favors players whose teams didn't jack up a lot of 3's. This could mean a variety of things including they are better teams because they didn't need to resort to 3's or just that their team's style didn't favor shooting 3's. Note that the third was weighted a bit more than the other two. Based on all of this my conclusion is that players will translate to better to the NBA if their teams are getting to the rack (less 3's and more FT's) which means better looks at the basket. Players who are going to the NBA are most likely stars for their team so their trends will dominate these kinds of numbers for their team. I could see this also being a strong indicator for PG's indirectly as if they are able to drive and dish to their bigs this could very easily translate to more FT's from getting fouled to prevent easy buckets. I found it very interesting that pace and quality of opposition stats team stats didn't show up here at all but I do believe (have not validated yet though) that these should play a role in the more non-linear weighting models.
- If you only look at combine stats then the following show up as the best indicators:
- no step vertical - A good analysis of this can be found here. In general this ability translates well towards athleticism, steals, and blocks which are all valuable to succeed in the NBA. Note that all other vertical measurements correlate highly but this one stands out the most.
- hand length - Once again this had a negative correlation. See above for analysis.
- agility - This showed up as a negative correlation (note that this means a higher agility speed is negatively weighted i.e. less agility means less likely to succeed). This makes sense as all the big time athletes in the NBA are agile and non-agile awkward big men don't often succeed. The only name I recognize in the top 50 worst agility times is Al Jefferson who has probably improved on his number since his high school days which this data is from. I was surprised that wingspan didn't show up higher here with the prototypical basketball players nowadays being able to guard anyone because of their length. I was also surprised to not see sprint but I guess that might make sense since basketball is more about quick movements (i.e. quickness and agility) and body control and not necessarily straight line running speed (unless you are Russell Westbrook on a fast break with no fear for anything in his path).
- There were a few other attributes which stood out now and then depending on what subset of attributes I included:
- College stats for: effective field goal percentage, player and team true shooting percentage, two point percentage - All of these are some form of shooting a high percentage which seems to be a strong indicator.
- College team win/loss percentage - Playing with and against other high level talent helps a player develop better. It also shows he is able to play for a winning team. It also means that he was probably highly recruited out of high school.
Algorithms performance and observations:
As a reminder, the value these models are trying to predict is PER*MinutesPlayed/SUM(PER*MinutesPlayed for everyone in the draft class). I will refer to this as "PER based metric" from now on.
Regression
Linear Regression
Top 10 Players:
- Anthony Davis 2012 1 0.078819389
- Jason Kidd 1994 2 0.12831107
- Elton Brand 1999 1 0.082014916
- Bradley Beal 2012 3 0.046049434
- Tyrus Thomas 2006 4 0.028786272
- Larry Johnson 1991 1 0.069850611
- Chris Webber 1993 1 0.096952186
- Andrew Bogut 2005 1 0.038072526
- Chris Paul 2005 4 0.081821717
- Kevin Love 2008 5 0.054385551
Nailed: Rajon Rondo, Zach Randolph, Thaddeus Young, Kawhi Leonard
Missed: Isaiah Thomas, Cuttino Mobley, Michael Redd, Sam Cassell, Kevin Martin
This was a close second in terms of performance and really nailed some stars which NBA teams didn't. The guys it missed on were mostly later draft picks - this is because it is a purely linear model which makes it hard for players to make up for being a low draft pick since that attribute is weighted so much. I was really stoked to see Rondo and Leonard up so high.
SMO
Top 10 Players:
- Anthony Davis 2012 1 0.078819389
- Kevin Love 2008 5 0.054385551
- Michael Kidd-Gilchrist 2012 2 0.03564448
- John Wall 2010 1 0.075625081
- Tyrus Thomas 2006 4 0.028786272
- Jason Kidd 1994 2 0.12831107
- Michael Beasley 2008 2 0.030118381
- Elton Brand 1999 1 0.082014916
- Mike Conley 2007 4 0.054838625
- Andrew Bogut 2005 1 0.038072526
Nailed: Rajon Rondo, Zach Randolph, Kyle Lowry, Richard Jefferson, Ramon Sessions, Mo Williams
Missed: Sam Cassell, Dikembe Mutombo, Brent Barry, Chandler Parsons, David West
This algorithm had the strongest performance out of any.
Neural networks
Top 10 Players:
- Jelani McCoy 1998 33 0.004973258
- Kemba Walker 2011 9 0.056146597
- Shane Battier 2001 6 0.046785295
- Sean Williams 2007 17 0.004981436
- Jordan Williams 2011 36 0.004156869
- Jordan Hamilton 2011 26 0.010490613
- William Avery 1999 14 0.001018979
- Jordan Williams 2011 36 0.004156869
- Jerome Jordan 2010 44 0.000854876
- Kenny Anderson 1991 2 0.070581139
Nailed: Steve Nash, Zach Randolph, David West, Ty Lawson
Missed: Dikembe Mutombo, Elton Brand, Glenn Robinson, Blake Griffin
Overall this did pretty poorly. I think this could do better with some tuning but I didn't explore further as it is very slow to run.
Classification
For these I had it classify yes/no with a .019 threshold (that was the mean over the draft history) on the PER based metric then take the percentage of votes as the ranking prediction. It might be worth tuning this number to see how it changes results.
RandomForest
Top 10 Players:
- Mike Miller 2000 5 0.073063387
- Kevin Love 2008 5 0.054385551
- Jamal Mashburn 1993 4 0.053647826
- Billy Owens 1991 3 0.042212507
- Anfernee Hardaway 1993 3 0.061881843
- Derrick Rose 2008 1 0.04064413
- Anthony Davis 2012 1 0.078819389
- Jamal Mashburn 1993 4 0.053647826
- Larry Johnson 1991 1 0.069850611
- Michael Beasley 2008 2 0.030118381
Nailed: Carlos Boozer, Zach Randolph, Richard Jefferson, David West, Jrue Holiday
Missed: Kenyon Martin, Randy Foye, Vin Baker, Jamal Crawford
This was a close third in terms of performance. The algorithm liked extremely different players compared to other successful models which is interesting. I think it could add a lot of value when combined with the regression based ones.
Naive Bayes
Top 10 Players:
- Dexter Pittman 2010 32 0.001362724
- Marquis Teague 2012 29 0.003101732
- Jared Jordan 2007 45 0
- DeMarcus Cousins 2010 5 0.078827364
- Bradley Beal 2012 3 0.046049434
- Nate Robinson 2005 21 0.029933846
- Tony Wroten 2012 25 0.019444896
- Jordan Farmar 2006 26 0.029808357
- Kemba Walker 2011 9 0.056146597
- T.J. Ford 2003 8 0.021386421
Nailed: Kemba Walker, Carlos Boozer, Zach Randolph, Richard Jefferson, David West
Missed: Michael Redd, Kenneth Faried, Kenyon Martin, Randy Foye, Vin Baker
Not a very great top 10 list huh? Overall this did pretty poorly but showed some signs on random guys but this just might be in fact…random.
NearestNeighbor
I calculated the X closest players from historical data for each player and then averaged out the PER based metric for each of those X players. For curiosities sake I also noted the best and worst case comparison. The higher value of X I used seemed to work better at calculating predictions but was worse at calculating the best/worst case comparisons mostly because everyone's best case comparison ended up being all of the same players such as Dwyane Wade. I also tried taking the min/max of the comparisons but those didn't prove to be very successful.
Top 10 Players:
- Elton Brand 1999 1 0.082014916
- Derrick Williams 2011 2 0.030250084
- Anthony Davis 2012 1 0.078819389
- Michael Beasley 2008 2 0.030118381
- Kevin Love 2008 5 0.054385551
- Kemba Walker 2011 9 0.056146597
- DeMarcus Cousins 2010 5 0.078827364
- Antawn Jamison 1998 4 0.070685947
- Tyler Zeller 2012 17 0.02960581
- Sean May 2005 13 0.003963906
Nailed: Zach Randolph, Jalen Rose, Gerald Wallace, Danny Granger, Nikola Vucevic
Missed: David Lee, Jamal Crawford, Randy Foye, Joakim Noah, Al Horford, Russell Westbrook, Jeff Green
Overall this actually did better than I would have expected. I noticed that the guys it misses on seem to have more unique playing styles such as Noah, Westbrook, Crawford which makes sense if it can't find comparable players then it won't work as well.
KMeansClustering
When I started this research I was really excited about trying out this one. I planned to build clusters on the historical data and then predict which clusters the draftees were closest to. However it didn't turn out that useful because all the clusters seemed to have very average players as the centroids. Also I couldn't get the algorithm to give me weights for each cluster and instead I just got one cluster for each prediction. Ideally I would have taken the weights and scaled the PER based metric for that cluster and then sum them all up. This meant all draftees were assigned to one cluster and all had the same prediction so instead what I had to do to get anything meaningful was to generate a ton of different clusters so that not all players would fall into only a few.
Top 10 Players:
- Chris Webber 1993 1 0.096952186
- DeMar DeRozan 2009 9 0.045910451
- Hasheem Thabeet 2009 2 0.005865803
- Blake Griffin 2009 1 0.060531458
- Brevin Knight 1997 16 0.038295037
- Tim Thomas 1997 7 0.042280221
- Stephon Marbury 1996 4 0.058750748
- Allen Iverson 1996 1 0.077402202
- Ray Allen 1996 5 0.084613864
- Joe Smith 1995 1 0.051591446
Nailed: Carlos Boozer, Terrell Brandon, Rajon Rondo, Kyle Lowry, Klay Thompson
Missed: David Lee, Rick Fox, Tayshaun Prince, Nikola Vucevic
Overall this model didn't do horrible but it didn't do that great either. If I could get the weightings for clusters I could it could do better.
Algorithm Performance
Here is a chart of overall correlation performance for each algorithm:
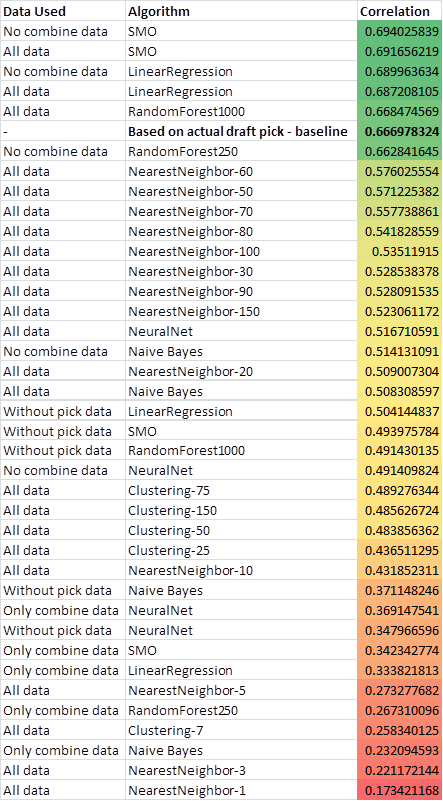
As you can see from the results: SMO, LinearRegression, and RandomForest were well above the rest and actually beat the baseline which is measured by the ranking of actual draft picks. It was interesting to find that not including combine data actually helped some of the models. This might have to do with a lot of the combine data is missing for older years and some algorithms handle missing values better than others. There is room for improvement here by better handling these missing values, adding more data, and/or better attribute selection. Another common technique is to blend models together which I may get into in a future post. When you don't include the actual pick data the models are greatly negatively impacted which I will talk about in the conclusions.
Here are year by year results for the best performing SMO model to see how it compares year by year:
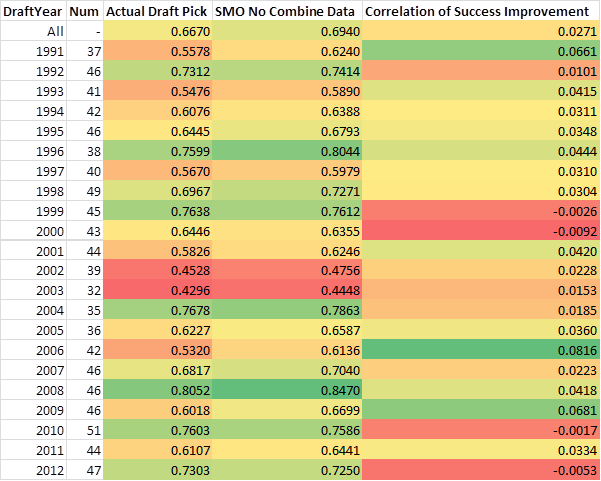
As you can see SMO regularly outperformed NBA teams. However more recently it hasn't done quite as well, I have some theories on why this might be. First, it could be that the model is trying to predict longevity which hasn't kicked in yet for more recent drafts and it may sway the performance toward the model's side in upcoming years. Secondly, it could be that the NBA teams are starting to use more analytics themselves in recent years and the "intelligence" the model is adding is already being taken into account as of recently.
Contact me if you want raw data to analyze and interpret yourself.
Conclusions
My original question was whether or not I could use machine learning to come up with long-term value predictions on par or better than NBA teams (as measured by the order in which they choose players). Based on my results I believe that as long as I take into account where a player is actually drafted (or predicted to be drafted as that should suffice as well) I can build a model which has proven to be a more historically reliable predictor of success compared to NBA teams draft results. However if my models do not take into account the players draft pick they do much more poorly. The reason for this is that my models can't replicate everything that scouts and analysts do but instead they seem to do well at providing additional knowledge on top of the draft rankings. Without some substantial improvements to the models they aren't currently outperforming NBA GM's but even without improving on what I have done they can still provide another valuable data point for the human evaluator to weigh.
With that being said I think there is a lot of opportunity for increasing performance by improving data quality (adding more data, handle missing better), improving attribute selection, and tuning the algorithms. In addition I think a big win could come from joining an assortment of models together (which ML would be very good at figuring out the optimal blending) to create a super model. The wisdom of the crowd has proven to be successful in many applications and this is another case which I think it could add a lot of value - I may try to touch on this in a later post.
Next up: 2014 projections