Anyone who has analyzed historical NBA draft picks should know that translating success to the NBA is never a sure thing. No matter how good the scout, GM, or draft model, there is still a high level of uncertainty involved in predicting NBA success.
My goal is to highlight this uncertainty. By putting less emphasis on a single number, and more emphasis on a probabilistic range of outcomes, our evaluation of players can be more representative of the roll of the dice that NBA teams face.
NBA Draft Model
This is my seventh year using machine learning to project NBA draftees. Each year brings an opportunity to reflect on previous results, revisit methodology, and experiment with new technology - all in hopes of having fun, learning, and most importantly improving projections! While my general approach is similar to previous years (such as 2018 or 2019), the biggest change I made this year was revamping my process in terms of how to factor in the context of player statistics.
Since many top prospects had limited data to base our evaluations on, properly dealing with small sample performances and incorporating non-NCAA data (i.e. HS, AAU, International) was essential this year. Additionally, as more players are choosing to play outside of the NCAA, streamlining my process for how to normalize statistics across different leagues was an area I set out to improve. This will pay off for years to come given the upcoming change to the minimum draft age, the new option for high schoolers to jump to the G League, and the continual rise of international players dominating the NBA - being able to gain insight from non-NCAA statistics is now more important than ever!
Without getting into all the details, you can think of my "contextualizing process" as a sequence of steps, where each step neutralizes a player's statistics to control for a specific factor that impacts player statistics (e.g. sample size, quality of opposition, three-point line distance). In the past I had fed raw statistics into a black box model alongside other pieces of data (e.g. minutes, pace, age, league), in hopes of implicitly controlling for different pieces of context. Instead, I am explicitly neutralizing individual contextual components one by one. This offers other benefits too - like being able to gain insight into interesting questions (What international league is the most difficult to rack up blocks? How does aging impact a player's usage?).
Data translation steps:
- Regress towards the mean (see my post on Empirical Bayes-ketball!)
- Normalize by era
- Normalize by age (upcoming post on aging curves!)
- Normalize by league (upcoming post on league factors!)
This approach allows us to compare all player performances on the same scale. I perform all of these translations on the data before feeding into a machine learning model that is trained to project future NBA success.
Projections are performed for each segment of data (i.e. player + year + league) - this is useful because you can easily observe how a player's draft potential changes across different seasons and situations. To get a final player projection, results are aggregated (weighted by minutes) across all historical data segments for a given player.
This year I'm withholding results from my Quant model to avoid unnecessary confusion when there are subtle differences on various players (will revisit this in the future). Therefore, I am only sharing results from my Star model - which predicts the probability of being an All Star (star), Starter (start), Role Player (role), or Bust (bust).
Other notable call outs this year:
- Model is "stats-only," which means it doesn't include high school rank, projected draft pick, or combine stats. The positive here is that it is not biased by narratives, isn't overly correlated with analyst projection, and provides a diverse data point from scouting. The downside is that some results may seem "off" relative to the consensus (i.e. Why are Ball and Edwards so low!?).1
- Probabilities are not well calibrated (i.e. they are directionally predictive but the star/starter percentages are muted relative to reality). While there is always room for improvement, this is partially due to a couple of intentional modeling decisions. First, because the model is "stats-only," it is more difficult to get a strong signal on higher end outcomes - since it doesn't have the help of draft projections to hone in on potential stars. Secondly, to avoid selection bias2 the model is trained on data spanning ALL players (including International, JC, D3, etc.) which makes "stars" even more rare in the underlying data (but also more meaningful when the model says there is a chance!).
While I recommend focusing on the full spectrum of projected outcomes, I realize there are times when a single number is unavoidable (i.e. draft board rank). Therefore, for my "ranking" I apply a custom heuristic which sorts players based on how teams generally behave (i.e. top picks ordered by star potential, next tier by starter+star potential, and the rest by role+starter+star, in all cases placing a higher weighting on upside potential).
Feel free to reach out to me on Twitter to discuss anything here.
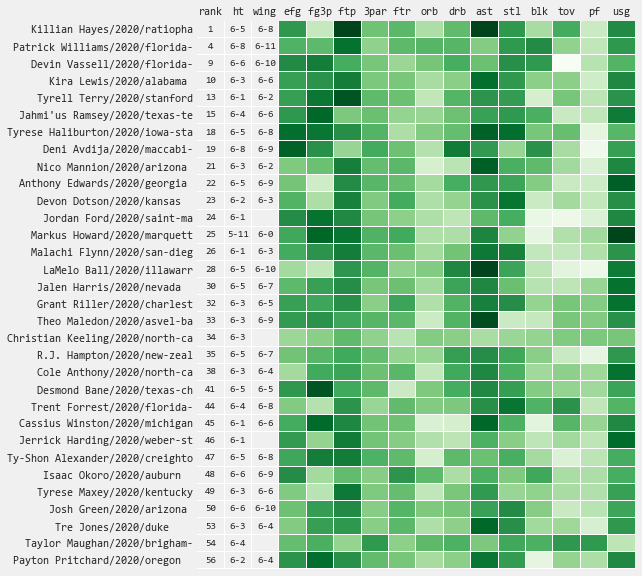
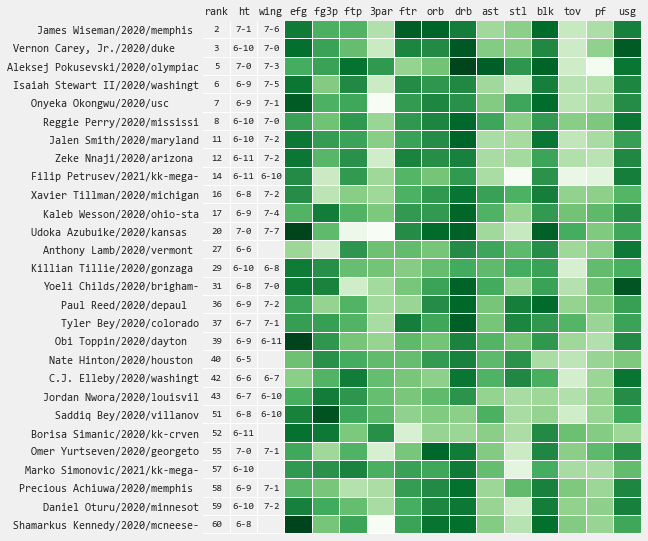
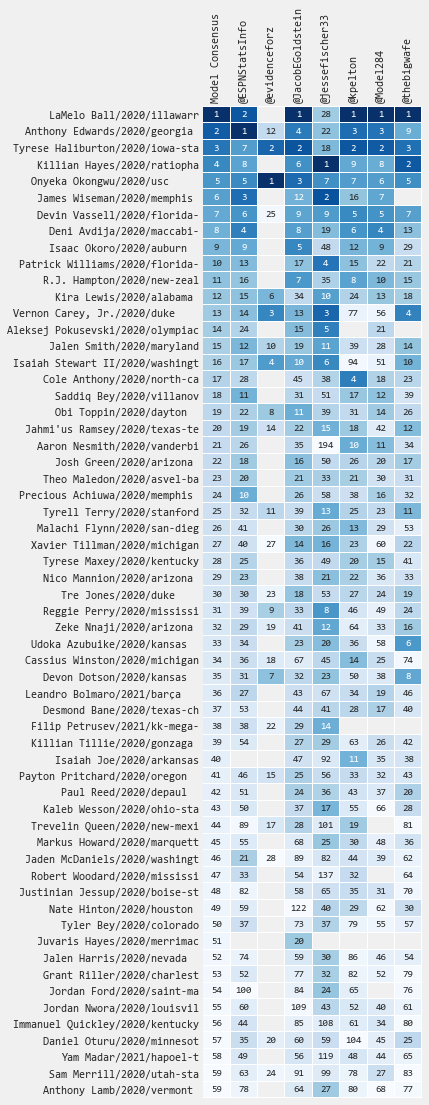
2020 Results
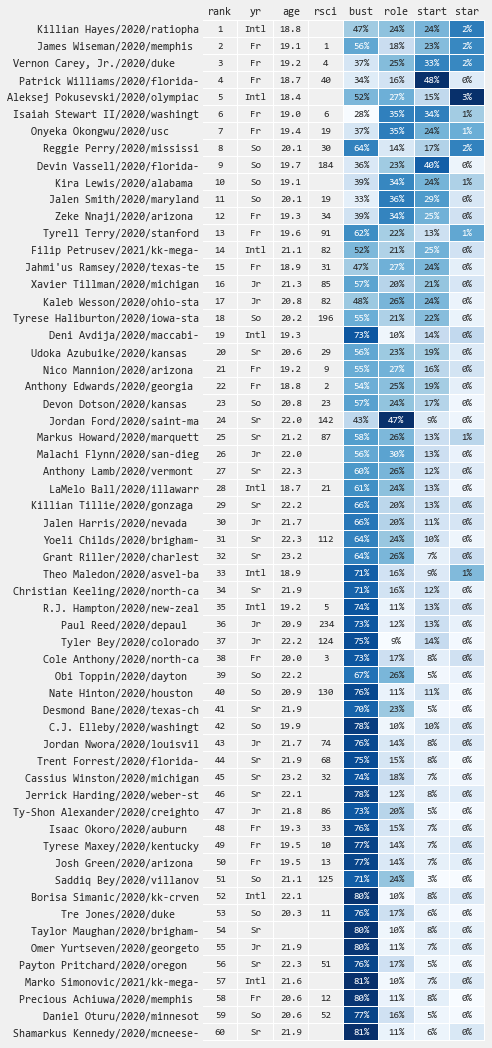
Top Guards
Top Bigs
Player Profiles
Select a player to see a player draft profile including:
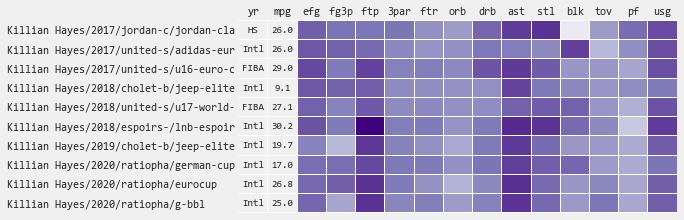
- Statistical Profile - visualize the strengths, weaknesses, and growth trajectory of individual players over their college careers
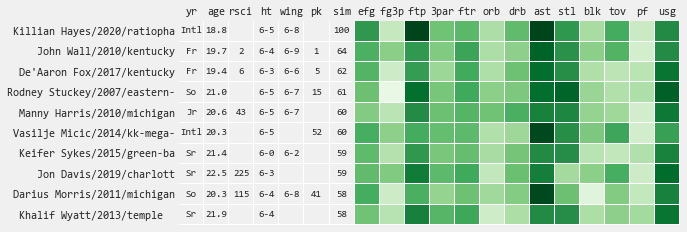
- Playing Style Comps - find the most similar player seasons compared to the potential draftees most recent season, which can keep you honest on a players expected outcome
- Draft Model Insight - better understand what statisitical factors are most impacting a player projection (based on most recent/highest minute season)
Killian Hayes
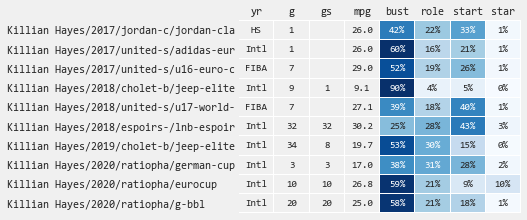
Statistical Profile
Playing Style Comps
Draft Model Insight
Draft Model Comparison
-
This year, I went in this direction because improvements made the "stats-only" model results more reasonable than in the past, so I wanted keep the model "pure". I have gone back and forth on this over time - both are interesting, so I'll probably bring back both in the future. ↩
-
As an example, if you only train a model on players who were drafted, then your model might learn that being under 6-feet is predictive of success based on a few data points of players who have overcome this roadblock. Training on all players allows the model to have stronger projections on fringe NBA players (Ethan Happ anyone!?) and/or to find diamonds in the rough. ↩