Bayesian Hierarchical Modeling
How to improve our prior by incorporating additional information?
In my last post I showed how, when faced with limited data, you can use Empirical Bayes (EB) to better evaluate a players three-point shooting. We can apply this same technique to NCAA three-point shooting across top projects in the upcoming NBA draft.
| name | team | 3p% (eb) | 3p% | 3pm | 3pa |
|---|---|---|---|---|---|
| Anthony Edwards | Georgia | 0.312 | 0.294 | 72 | 245 |
| James Wiseman | Memphis | 0.329 | 0.000 | 0 | 1 |
James Wiseman, who missed his only three-point attempt has an EB estimate of 32.9%. His actual shooting percentage had very little impact on his EB estimate. Essentially his percentage was fully regressed to the empirical prior (i.e. league average).
We can see that Wiseman had an EB estimate higher than Anthony Edwards (31.2%), even though Edwards had a higher 3P% (29.4%) - but do we really think Wiseman is a better three-point shooter? What else do we know about these players?
As a Bayesian, we should define our priors about three-point shooting.
- Good shooters are good shooters1 (i.e. Higher FT% = Higher 3P%)
- You only get to shoot 3s if you can - there are always exceptions (i.e. Higher 3PAR = Higher 3P%)
While still small sample sizes, we can take advantage of having slightly more data on FT% and 3PAR - let's see how Wiseman and Edwards stack up in these other areas.
| name | team | ft% | 3par |
|---|---|---|---|
| Anthony Edwards | Georgia | 0.772 | 0.485 |
| James Wiseman | Memphis | 0.704 | 0.039 |
Edwards was a better free-throw shooter (77.2% vs. 70.4%). He also had a significantly higher 3PAR (0.485 vs. 0.039). Based on these additional data points, our assumption is that Edwards is probably a better three-point shooter.
Now how can we factor this additional information into our prior…Bayesian hierarchical modeling!
Bayesian hierarchical modeling is a statistical model written in multiple levels (hierarchical form) that estimates the parameters of the posterior distribution using the Bayesian method. The sub-models combine to form the hierarchical model, and Bayes' theorem is used to integrate them with the observed data and account for all the uncertainty that is present.
There are many different ways to approach hierarchical modeling. You could extend our previous empirical bayes approach as described here (which might include using the ebbr package). However, if you are anything like me, once you get a taste of Bayesian statistical modeling you will quickly find yourself deep down a rabbit hole - exploring all the different probabilistic programming frameworks out there, such as PyMC and Stan.
For a basic introduction, you can find sports related examples like analyzing NFL 4th down attempts or predicting rugby outcomes. For a more in-depth understanding, I recommend reading more about multilevel modeling, complex hierarchical modeling, or scaling your model via variational inference.
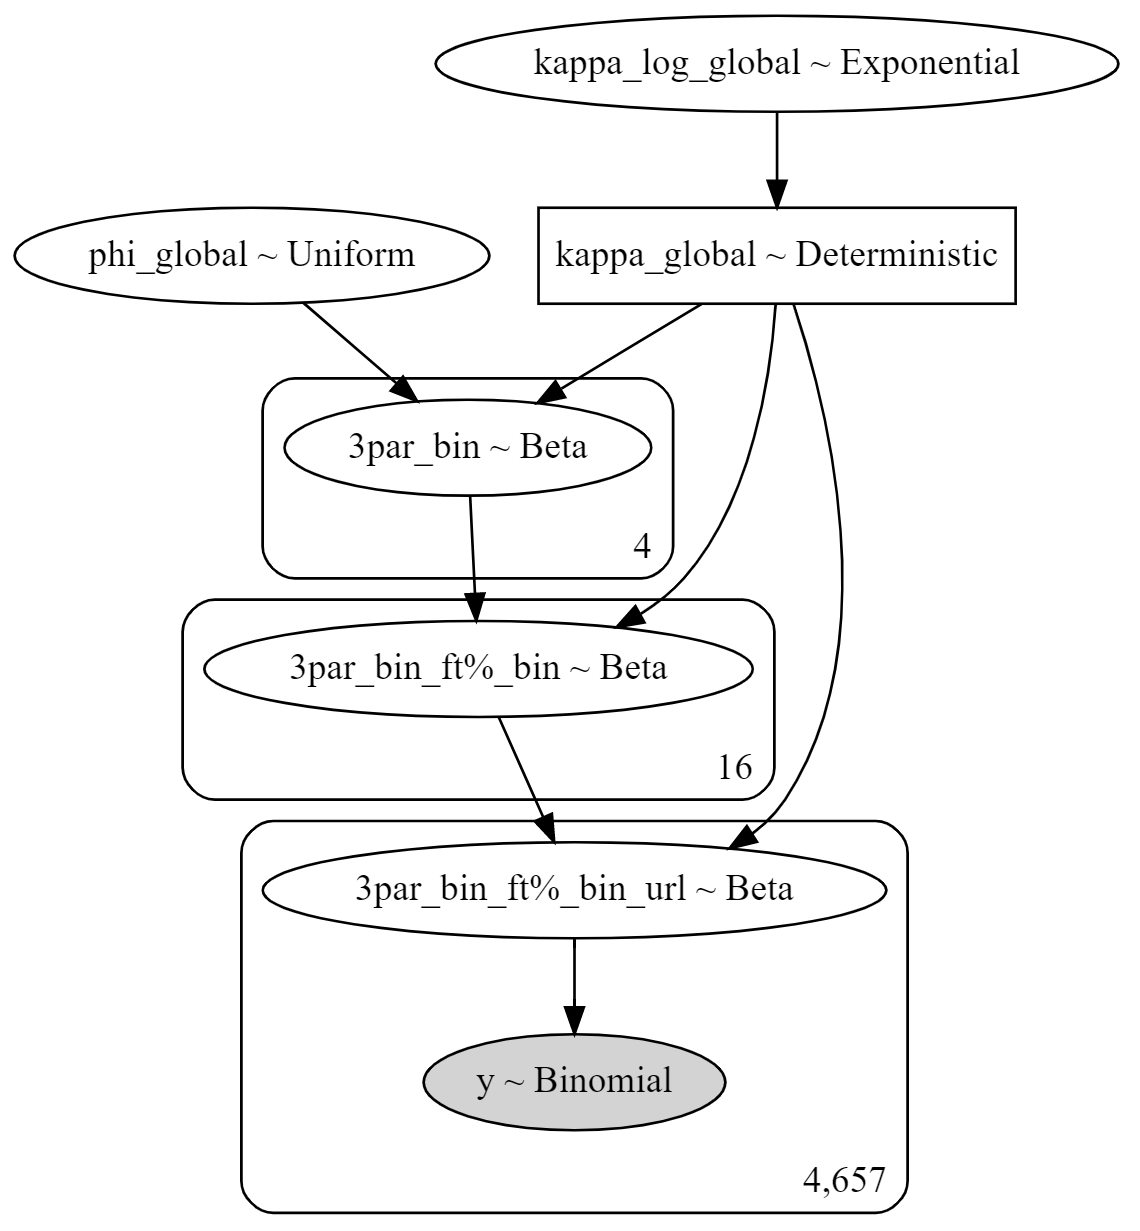
Now back to apply our problem! As I said, there is no single right way to setup a hierarchical model. It is also worth mentioning that I'm relatively new to Baysian modeling so I won't claim to know what is actually best (feedback please!). With that out of the way, one approach is to use a hierarchical prior based on a players FT% and 3PAR quartile. Using PyMC3 I am able to model three-point shooting as a beta binomial distribution (I'll repeat - feedback from any experts please!).
One benefit of using Bayesian modeling tooling, is that with a few lines of code you get pretty charts like this.
You can also calculate a credible interval to see how the expected distribution changes based on your different groups (in our case FT% and 3PAR quartiles).
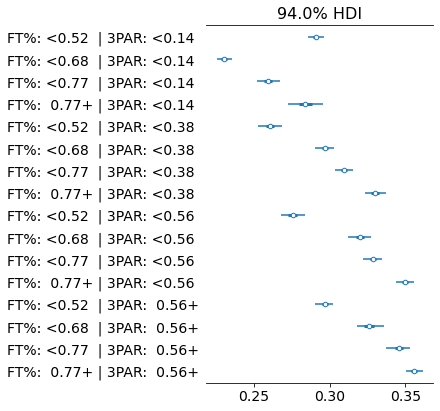
In the chart above we can see how players with a high FT% and 3PAR (like Anthony Edwards) have a higher credible interval distribution than a player with above average FT% but low 3PAR (like James Wiseman).
| name | team | 3p% (hierarchical) | 3p% (eb) | 3p% (actual) | 3pm | 3pa |
|---|---|---|---|---|---|---|
| Anthony Edwards | Georgia | 0.302 | 0.312 | 0.294 | 72 | 245 |
| James Wiseman | Memphis | 0.256 | 0.329 | 0.000 | 0 | 1 |
The hierarchical model pulls Wiseman's estimate toward a more informed prior, which makes his three-point shooting estimate now much lower than that of Edwards (25.6% vs. 30.2%).
Below we can see what the hierarchical model infers about 2020 college performances from the ESPN Top 60 in the upcoming draft.
| espn | name | team | 3p% (hierarchical) | 3p% (eb) | 3p% (actual) | 3pm | 3pa | ft% | 3par |
|---|---|---|---|---|---|---|---|---|---|
| 11 | Aaron Nesmith | Vanderbilt | 0.455 | 0.391 | 0.522 | 60 | 115 | 0.825 | 0.561 |
| 41 | Desmond Bane | Texas Christian | 0.419 | 0.381 | 0.442 | 92 | 208 | 0.789 | 0.477 |
| 18 | Saddiq Bey | Villanova | 0.418 | 0.38 | 0.451 | 79 | 175 | 0.769 | 0.477 |
| 30 | Cassius Winston | Michigan State | 0.408 | 0.371 | 0.432 | 73 | 169 | 0.852 | 0.409 |
| 52 | Immanuel Quickley | Kentucky | 0.401 | 0.366 | 0.428 | 62 | 145 | 0.923 | 0.438 |
| 37 | Payton Pritchard | Oregon | 0.398 | 0.369 | 0.415 | 88 | 212 | 0.821 | 0.459 |
| 29 | Jahmi'us Ramsey | Texas Tech | 0.395 | 0.367 | 0.432 | 60 | 139 | 0.641 | 0.415 |
| 8 | Tyrese Haliburton | Iowa State | 0.394 | 0.36 | 0.419 | 52 | 124 | 0.822 | 0.508 |
| 42 | Tyrell Terry | Stanford | 0.388 | 0.36 | 0.408 | 62 | 152 | 0.891 | 0.456 |
| 44 | Jordan Nwora | Louisville | 0.387 | 0.361 | 0.402 | 76 | 189 | 0.812 | 0.44 |
| 57 | Kaleb Wesson | Ohio State | 0.38 | 0.358 | 0.425 | 45 | 106 | 0.731 | 0.346 |
| 45 | Skylar Mays | LSU | 0.375 | 0.352 | 0.394 | 50 | 127 | 0.854 | 0.369 |
| 16 | Devin Vassell | Florida State | 0.37 | 0.356 | 0.415 | 44 | 106 | 0.738 | 0.361 |
| 53 | Killian Tillie | Gonzaga | 0.368 | 0.349 | 0.4 | 36 | 90 | 0.726 | 0.391 |
| 38 | Malachi Flynn | San Diego State | 0.366 | 0.349 | 0.373 | 76 | 204 | 0.857 | 0.489 |
| 26 | Robert Woodard | Mississippi State | 0.363 | 0.352 | 0.429 | 30 | 70 | 0.641 | 0.255 |
| 25 | Kira Lewis | Alabama | 0.355 | 0.344 | 0.366 | 56 | 153 | 0.802 | 0.341 |
| 6 | Obi Toppin | Dayton | 0.354 | 0.345 | 0.39 | 32 | 82 | 0.702 | 0.212 |
| 39 | Grant Riller | Charleston | 0.351 | 0.341 | 0.362 | 47 | 130 | 0.827 | 0.286 |
| 22 | Josh Green | Arizona | 0.349 | 0.338 | 0.361 | 30 | 83 | 0.78 | 0.288 |
| 43 | Elijah Hughes | Syracuse | 0.346 | 0.336 | 0.342 | 78 | 228 | 0.813 | 0.491 |
| 46 | Isaiah Joe | Arkansas | 0.345 | 0.336 | 0.342 | 94 | 275 | 0.89 | 0.764 |
| 20 | Jalen Smith | Maryland | 0.345 | 0.34 | 0.368 | 32 | 87 | 0.75 | 0.279 |
| 14 | Cole Anthony | North Carolina | 0.341 | 0.337 | 0.348 | 49 | 141 | 0.75 | 0.409 |
| 34 | Tre Jones | Duke | 0.341 | 0.34 | 0.361 | 39 | 108 | 0.771 | 0.282 |
| 50 | Cassius Stanley | Duke | 0.34 | 0.338 | 0.36 | 31 | 86 | 0.733 | 0.319 |
| 21 | Nico Mannion | Arizona | 0.335 | 0.329 | 0.327 | 53 | 162 | 0.797 | 0.441 |
| 24 | Jaden McDaniels | Washington | 0.334 | 0.333 | 0.339 | 43 | 127 | 0.763 | 0.378 |
| 12 | Patrick Williams | Florida State | 0.327 | 0.329 | 0.32 | 16 | 50 | 0.838 | 0.242 |
| 49 | Reggie Perry | Mississippi State | 0.318 | 0.329 | 0.324 | 23 | 71 | 0.768 | 0.194 |
| 33 | Devon Dotson | Kansas | 0.317 | 0.323 | 0.309 | 38 | 123 | 0.83 | 0.316 |
| 28 | Tyler Bey | Colorado | 0.309 | 0.34 | 0.419 | 13 | 31 | 0.743 | 0.117 |
| 51 | Paul Reed | DePaul | 0.308 | 0.326 | 0.308 | 16 | 52 | 0.738 | 0.147 |
| 36 | Daniel Oturu | Minnesota | 0.306 | 0.336 | 0.365 | 19 | 52 | 0.707 | 0.123 |
| 15 | Tyrese Maxey | Kentucky | 0.305 | 0.318 | 0.292 | 33 | 113 | 0.833 | 0.322 |
| 1 | Anthony Edwards | Georgia | 0.302 | 0.312 | 0.294 | 72 | 245 | 0.772 | 0.485 |
| 54 | Ashton Hagans | Kentucky | 0.296 | 0.316 | 0.258 | 16 | 62 | 0.81 | 0.234 |
| 31 | Udoka Azubuike | Kansas | 0.295 | 0.33 | 0.0 | 0 | 0 | 0.441 | 0.0 |
| 7 | Isaac Okoro | Auburn | 0.293 | 0.321 | 0.286 | 20 | 70 | 0.672 | 0.287 |
| 40 | Xavier Tillman | Michigan State | 0.282 | 0.319 | 0.26 | 13 | 50 | 0.667 | 0.167 |
| 27 | Isaiah Stewart II | Washington | 0.274 | 0.324 | 0.25 | 5 | 20 | 0.774 | 0.059 |
| 35 | Zeke Nnaji | Arizona | 0.267 | 0.328 | 0.294 | 5 | 17 | 0.76 | 0.054 |
| 10 | Precious Achiuwa | Memphis | 0.264 | 0.33 | 0.325 | 13 | 40 | 0.599 | 0.108 |
| 32 | Vernon Carey, Jr. | Duke | 0.264 | 0.334 | 0.381 | 8 | 21 | 0.67 | 0.061 |
| 58 | Nick Richards | Kentucky | 0.263 | 0.33 | 0.0 | 0 | 0 | 0.752 | 0.0 |
| 5 | Onyeka Okongwu | USC | 0.261 | 0.329 | 0.25 | 1 | 4 | 0.72 | 0.014 |
| 3 | James Wiseman | Memphis | 0.256 | 0.329 | 0.0 | 0 | 1 | 0.704 | 0.038 |
Below are some notable players that I thought stood out:
- Vernon Carey - He shot a good percentage for a big (38.1%) but he only had 21 attempts and his lower FT% and 3PAR might make us reconsider how much of his shooting was due to luck.
- Tyler Bey - Similar to Carey, Bey shot extremely well on the season (41.9%) but he only had 31 attempts and with a low 3PAR, the numbers say he might have been closer to a 30.9% shooter over a larger sample.
- Ashton Hagans - With such a high FT% (81%), the hierarchical model suggests that Hagans had some bad luck and is a better three-point shooter than his percentage (25.8%) would indicate.
In summary, a hierarchical model is more complex than basic empirical bayes - however the added complexity allows us make to more accurately adjust our prior by incorporating additional information.
-
Kevin Pelton has done work showing that college FT% is predictive of NBA 3P% ↩