When do NBA teams change possession timing behavior?
Possession Timing 101 - Possession Length Correlation
This is a piece from the Possession Timing 101 multi-part series where we will be diving even further into the topic of possession timing as introduced by the research paper: Optimizing End Of Quarter Shot-Timing In The NBA: "Everyone Knows About The 2 For 1, But What About The 3 For 2?" (pdf). Throughout these posts I hope to: review concepts and results from the research, explore ideas not covered in the paper, and share many more visuals. tothemean is the place to read about strategic possession timing in the NBA.
When do NBA teams change possession timing behavior?
The "2-for-1" and "end-of-quarter" shot timing strategies are fairly basic and it would be surprising if NBA teams weren't actively performing these strategies. In my last post I suggested that there might be an opportunity for additional strategies beyond the "2-for-1" range. This post will take an initial stab at seeing what variations of possession timing strategies are being used across the NBA. It will be a basic recap from the paper which took a deep look at possession length and behavior differences throughout the course of a game.
To measure possession length behavior, the paper calculated possession length distributions for all possible possession start times:
A possession length distribution provides the probability of ending a possession in 0, 1, …, 24 seconds for a particular possession start time1
The chart below shows possession length distributions for a handful of notable possession start times:
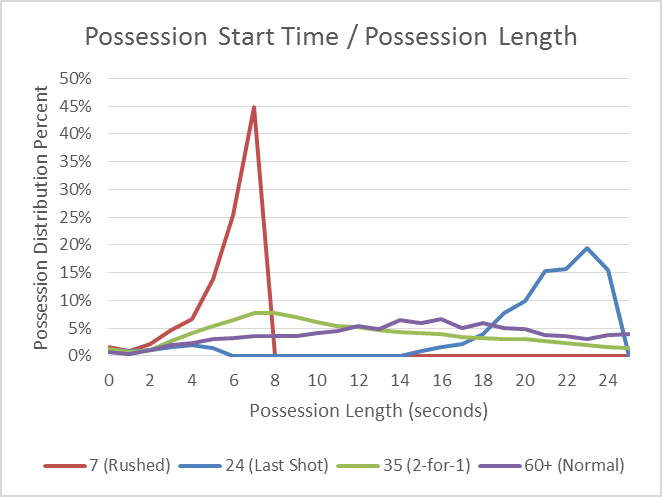
As seen, there are obvious differences in behavior at particular points in the game. To find all such outliers, the paper looked at the correlation between the possession length distributions across all possession start times. What does this mean? Each possible start time has a possession length distribution and this distribution can be compared with the "normal" possession length distribution. If correlation between the two is high then it would indicate that possessions starting at that time follows "normal" possession timing, whereas if the correlation is low then that would mean that teams are frequently performing "abnormal" possession timing for that particular start time. The paper used the following criteria for "normal":
For this study, "normal behavior" is defined as all times, other than the whole fourth quarter, overtime, or the final two minutes of each quarter.
Here is a chart showing how correlation compares with "normal" across all possession start times in a game2:
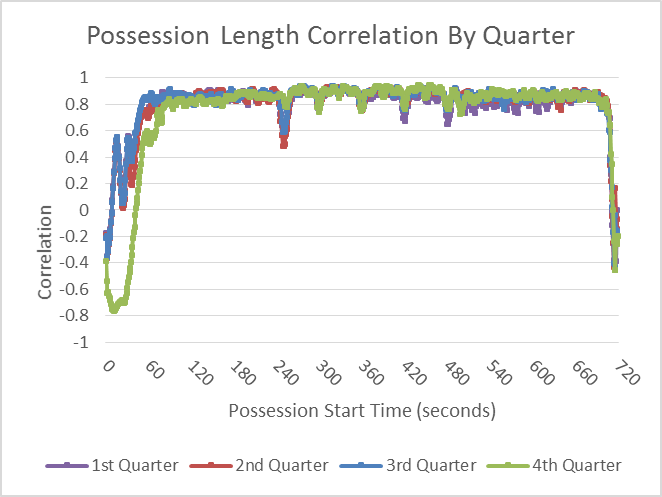
If you ignore the first and last minute of the quarters the correlation is consistently above .8 (significant). There are a few minor drops but this is likely because my data source isn't perfect.3 The end of the quarter seems to show "abnormal" behavior as expected. The beginning of the quarter also shows "abnormal" behavior - this is partly from a smaller number of data points.
Since this series is mostly focusing on end of quarter possession timing strategies, we are going to zoom in on the last two minutes.
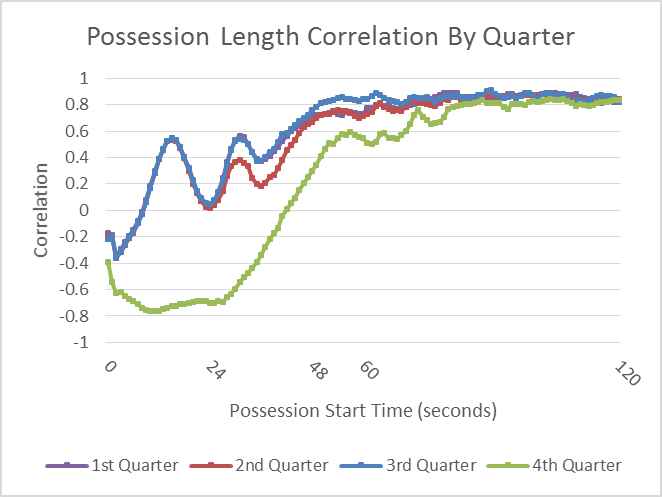
It looks as though the first 3 quarters follow consistent trends with each other whereas the 4th quarter diverges a bit. This has been touched on in previous posts (likely caused by fouling, running out the clock, etc). For this research we are going to ignore the 4th quarter and all of the extra complexities which come with it. Here is a graph of the first three quarters combined:
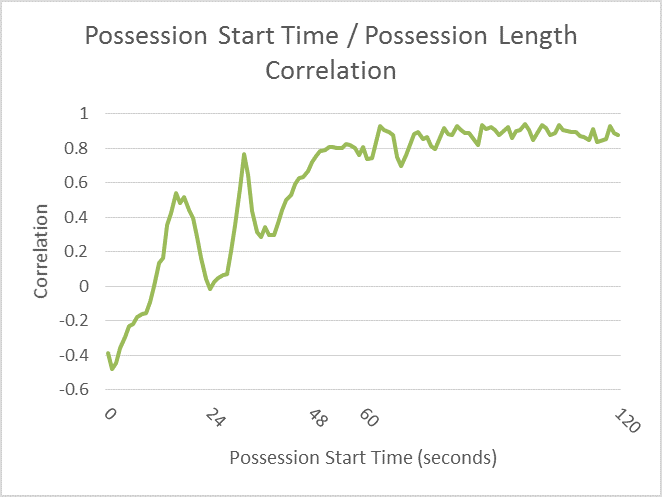
The final minute is really when teams start to change behavior. The changes appear to start before the "2-for-1" time frame. Does this mean intentional timing strategies are being used beyond the basic "2-for-1"? Well…it is hard to say definitively without diving a little deeper. In our next post we will hope to better understand this by looking at what the actual changes in behavior are.
Stay tuned for more posts in the Possession Timing 101 multi-part series.
-
Overtime was not included here ↩
-
For whatever reason my data source (backed by ESPN) has zero events occurring at seemingly random seconds in the game. Then a second or two in either direction has a disproportionate larger amount of events. For example, there are no events occurring with 62 seconds left in the quarter and around twice as many at 60 seconds. It is as though the play by play data capture tool didn't allow events to be added at various seconds in the quarter and automatically shifted the events to a nearby second. Note that these don't occur in the final minute of the quarter. ↩