Skip below if you just want to see the results!
PLUM Draft Model
The PLUM WNBA draft model is based off of my "Longevity" NBA draft model. The PLUM model follows the same philosophy of using machine learning to objectively predict the future performance of players. The model is named after Kelsey Plum, given that she was the inspiration).
PLUM - a draft model to objectively predict the potential of future WNBA draftees.
In particular, the PLUM model predicts WNBA performance using college player game log data (since 2010) while controlling for player characteristics (year in school, height), efficiency (minutes), level of competition, team quality, pace, etc. By factoring in individual game performances, it is able to learn more from strong performances in games against the best competition, which will not show up in season averages. The model is predicting the max win shares a player will have in their WNBA career (where replacement level players will have a value of -2 and All Stars are typically upwards of 4). Additionally, throughout this post, you will also see references to the "drafted" (wnba) and "all star" (star) models, which predict the probability a player being selected in the draft and/or becoming a WNBA All Star.
No model is perfect so it is worth mentioning some known areas of improvement:
- Currently lacks "scouting" information (high school rank, mock draft rank)
- The final PLUM rating only considers players most recent season (rather than intelligently learning from a players prior college seasons)
Historical Results
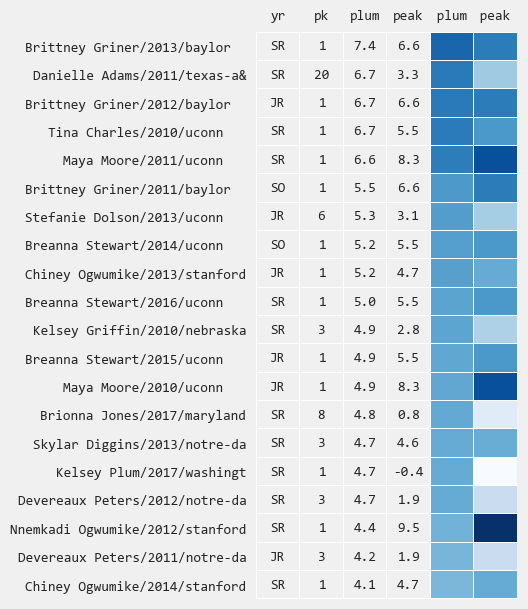
Below are the top 20 player seasons as rated by PLUM historically 1
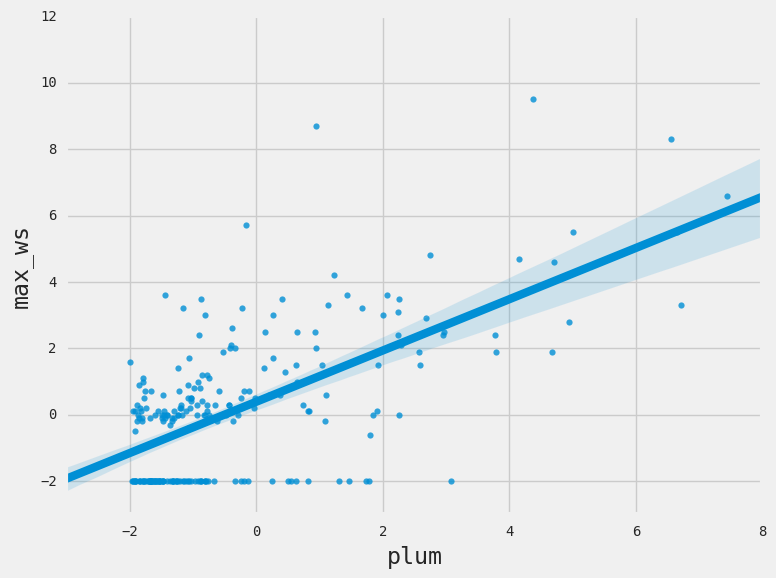
While the model definitely has room for improvement, the (out of sample) results below show that, in general, it performs quite well. Year by year historical results can be in the WNBA draft board tool.
2018 PLUM Rankings
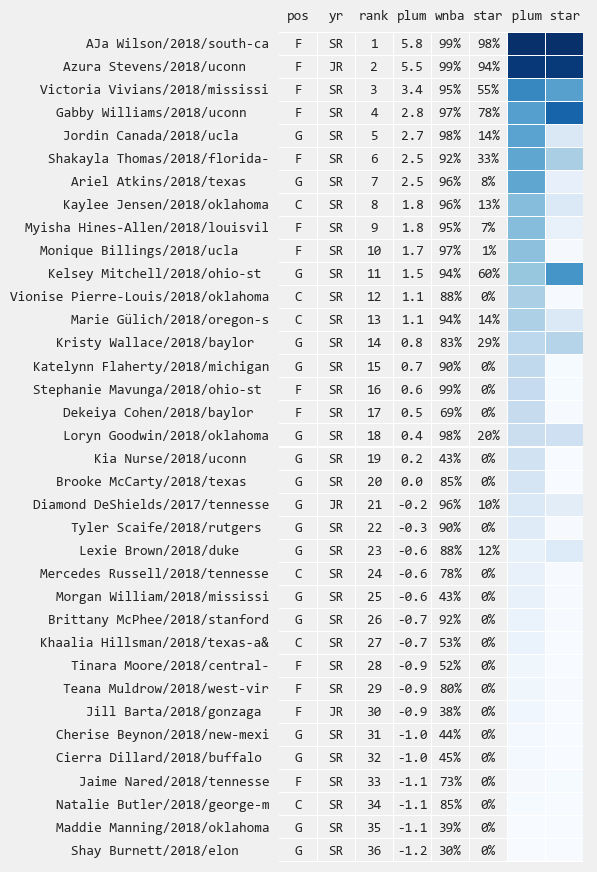
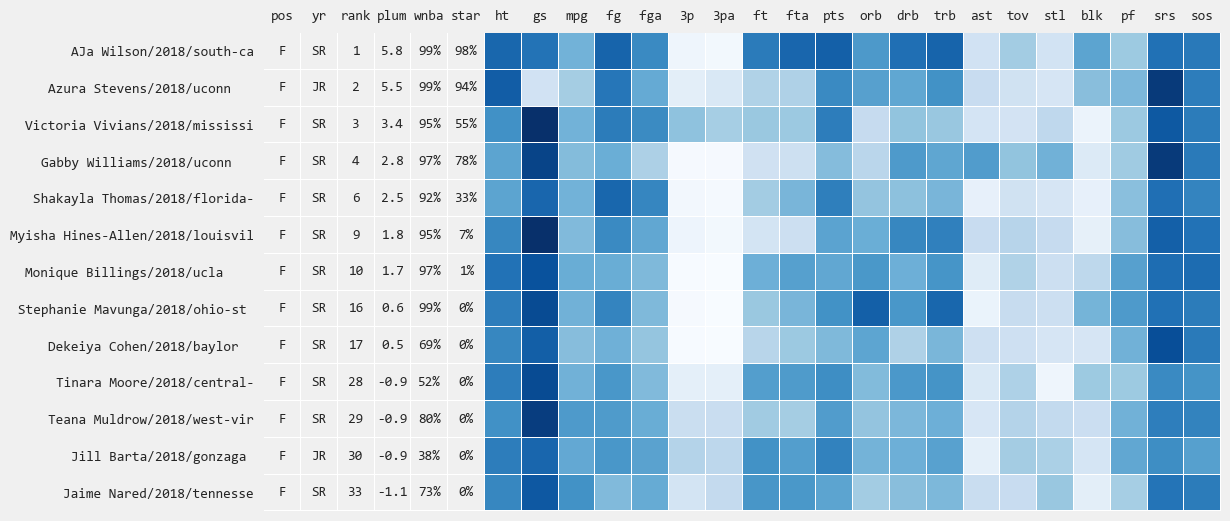
Below you will find rankings across various groupings. The heat map images hope to highlight strengths and weaknesses across players without overwhelming you with numbers. Darker colors are typically better2 (except for turnovers). If you are not a fan of heat maps, you should turn back now. See the glossary at the bottom for any non-obvious column names.
2018 Top 36
Guards
Notice how Kelsey Mitchell's lack of steals is hurting her compared to other highly ranked guards
Forwards
Not surprisingly, Stevens is the only player rated in the top 36 by the PLUM model that doesn't start
Centers
Notice Kaylee Jensen's lack of turnovers
All Star Potential
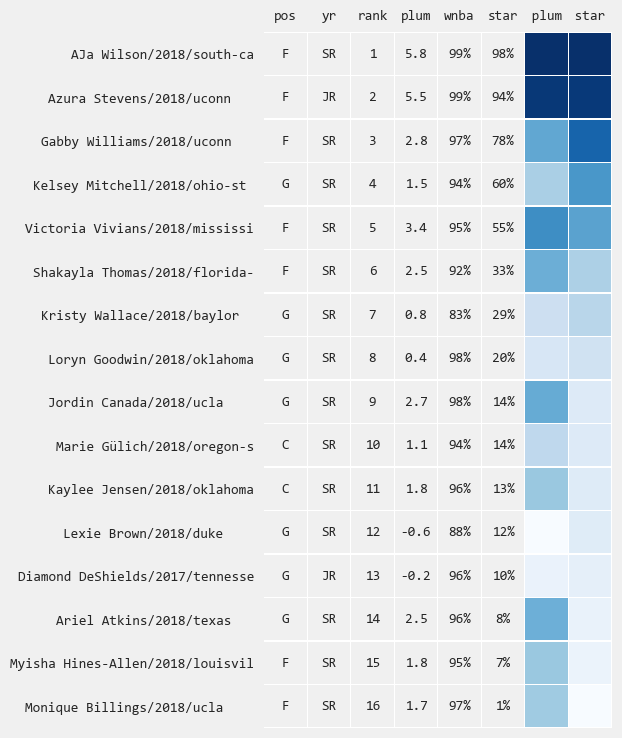
Below are the 16 players in the draft with a 1% or higher WNBA All Star probability. Notice how Kelsey Mitchell's star power potential doesn't directly match up with her PLUM rating, while the opposite is true for other highly ranked guards (Canada/Atkins).
Mock Comparison
Here is how the PLUM rating compares with various mock drafts I could find (draftsite.com, highposthoops, and wbasketballblog). Some differences in opinion are obvious (uncertainty around Wallace injury, Baylor team quality highly valued by PLUM) but many are not intuitive without further analysis.
I will leave it to the reader to try to understand some of the differences that are showing up in the data but not in the mock drafts. Please share any interesting learnings or observations, especially if you think PLUM seems systematically off in a particular area, as there is always room for improvement.
Growth & Comparables
Below you can visualize the growth trajectory of individual players over their college careers (such as AJa dominating since day one or DeShields steady decline).
Additionally, the green colored images show the most similar player seasons compared to the potential draftees most recent season, which can help prevent you from overestimating a players potential. The "sim" number represents the similarity between the two players on a scale of 0-100.
1. Wilson, AJa - South Carolina / SR / F
2. Stevens, Azura - UConn / JR / F
3. Vivians, Victoria - Mississippi St. / SR / F
4. Williams, Gabby - UConn / SR / F
5. Canada, Jordin - UCLA / SR / G
6. Thomas, Shakayla - Florida St. / SR / F
7. Atkins, Ariel - Texas / SR / G
8. Jensen, Kaylee - Oklahoma St. / SR / C
9. Hines-Allen, Myisha - Louisville / SR / F
10. Billings, Monique - UCLA / SR / F
11. Mitchell, Kelsey - Ohio St. / SR / G
12. Pierre-Louis, Vionise - Oklahoma / SR / C
13. Gulich, Marie - Oregon St. / SR / C
14. Wallace, Kristy - Baylor / SR / G
15. Flaherty, Katelynn - Michigan / SR / G
16. Mavunga, Stephanie - Ohio St. / SR / F
17. Cohen, Dekeiya - Baylor / SR / F
18. Goodwin, Loryn - Oklahoma St. / SR / G
19. Nurse, Kia - UConn / SR / G
20. McCarty, Brooke - Texas / SR / G
21. DeShields, Diamond - Tennessee / JR / G
22. Scaife, Tyler - Rutgers / SR / G
23. Brown, Lexie - Duke / SR / G
24. Russell, Mercedes - Tennessee / SR / C
25. William, Morgan - Mississippi St. / SR / G
26. McPhee, Brittany - Stanford / SR / G
27. Hillsman, Khaalia - Texas A&M / SR / C
28. Moore, Tinara - Central Mich. / SR / F
29. Muldrow, Teana - West Virginia / SR / F
30. Barta, Jill - Gonzaga / JR / F
31. Beynon, Cherise - New Mexico / SR / G
32. Dillard, Cierra - Buffalo / SR / G
33. Nared, Jaime - Tennessee / SR / F
34. Butler, Natalie - George Mason / SR / C
35. Manning, Maddie - Oklahoma / SR / G
36. Burnett, Shay - Elon / SR / G
Glossary
- wnba = WNBA draft probability
- star = WNBA All Star probability
- ht = Height
- gs = Games Started
- gp = Games Played
- mpg = Minutes Per Game
- srs = Team Quality (custom metric)
- sos = Strength of Schedule (custom metric)
- max_ws/peak = Max Win Shares
- pk = WNBA Draft Pick
- sim = Player Similarity
-
This spans college seasons 2010->2017 for every single D1 player ↩
-
The actual shading is based on how many standard deviations a particular value is above/below the average. You may notice that some columns (SRS/SOS) are frequently darker. This is because the top WNBA worthy players are typically playing for the top schools, against the best competition. ↩
