Are hot new data trends actually making NBA teams dumber?
Analyzing past, present, and future market inefficiencies in the NBA Draft
Introduction
In my last post I did some analysis trying to see if I could find any historical market inefficiencies in the NBA draft. I was looking in general across all drafts since 1991. However as I pointed out, the trends will likely change over time. Only recently have teams started using advanced analytics to influence draft decisions. In addition, the game itself has changed over time - an example of this can be seen from the ever increasing number of three pointers teams are taking each year. Even desired skill sets for players are changing - you didn't see the Jordan-era Bulls caring about having a "stretch-4". Nowadays players don't fall into strict categories - some people say only 3 positions exist (post, wing, guard) whereas others say we have 13! Even the league agrees things have changed with the removal of the Center from the All-Star ballot. Not to mention, the amount of data on players is increasing at alarming rates - you didn't hear scouts rave about a players hand size in the 90's.
Trends will continue to change as we go forward and being at the forefront of these trends will be a key to success. In order to have a better chance at predicting the future it is valuable to understand the past as well as the present. In this post I want to look at how the teams perceived value of certain attributes has changed over the years and how this compares with actual long-term value. Through this we should be able to find some market inefficiencies from the past and make some educated guesses on current and future trends.
Methodology
Initially I intended to run similar experiments to those that I did in my last post to see which attributes were the best indicators of long-term success and importance in determining NBA draft pick number and then compare across each individual season. I also thought that if I looked at groupings of consecutive 3-5 season chunks this might help smooth out the results a bit. However once I started down this path I found that the results were not that meaningful. One problem was that a lot of these attributes have high correlation with each other. For example one year effective field goal percentage might have been a strong indicator whereas another year two point percentage might have shown up as important instead. When that happens it is hard to understand if something important actually changed or if both attributes were strong indicators both years but it so happened that one year one attribute fit the data slightly better whereas another year the other attribute did. Another problem is that I don't have all attributes for all players across all years. For example I don't have college win shares data on players before 1998. This meant that prior to 1997 the data could have shown blocks and points per game were strong indicators whereas in 1998 it might have shown that neither remained strong indicators but instead win shares was extremely strong. Did anything really change in what the teams were valuing over that 1 year period? Probably not - instead the teams were most likely indirectly considering "win shares" in 1997, however since the model didn't have the data it couldn't make that conclusion. (Side note: Trying to reverse engineer historical win shares - through a simpler formula on data which is available or by using machine learning on the attributes I did have for those years could help back-fill some of this missing data. This was indirectly done in my original post about using machine learning to predict long-term value. However for this study I didn't go down that path). As you can see with my desired methodology there were some major obstacles to get a year by year comparison of importance, therefore I had to change my methodology a bit.
After brainstorming I decided to look at the yearly correlation of individual attributes with "pk" as well as "perPercentOfDraftMinusExpected". The meaning of "pk" is the draft pick number of the player - I use this to represent "NBA team expected value". Similarly in simple terms "perPercentOfDraftMinusExpected" means how much a player exceeded his draft expectations. See the "Building a model which predicts draft pick overachievers" section from here for more info. By being able to compare correlation of attributes with "pk" you are able to see which traits NBA teams put value in when drafting. Comparing correlation of attributes with "perPercentOfDraftMinusExpected" you are able to see what attributes teams are under/over valuing and then get a feel for potential market inefficiencies.
Notes:
- Once again I want to point out that I am making an assumption that teams are drafting based on "long-term" value. In practice some teams might be intentionally undervaluing certain attributes because they feel the attributes don't lead something they care more about. For example they might be more interested in taking a risk on a potential superstar (with a high chance of bust) rather than on a safe player they know will be a solid starter but who doesn't have star power potential. In a future post I want to do some analysis on "star power".
- In addition, the metric "perPercentOfDraftMinusExpected" is based on PER so if you don’t like how it weights various statistics this might not be showing you exactly what you care about in terms of "overachieving" but in general if you overachieve in one set of advanced stats you are also overachieving in PER. Note that it would be very easy to swap this out for some other metrics to see different results if you wanted to optimize for something else.
- Using correlation is meaningful when looking at independent single attribute relationships. However it is limited in understanding more complex combination of attributes, for example PG+ShortHeight+BigHands being undervalued is not something this this type of methodology can give insight to.
- In the charts I ignored all attributes for a draft year if I didn't have data for more than 60% of the college players from that draft year. This helps avoid some cases where a single data point (i.e. vertical in the early 90s) could make it look like an attribute had a very high/low correlation and in general prevents very small sample sizes from skewing results.
- If data points are missing in the charts that means that I didn't have 60% or more coverage for players from that year or else data was missing entirely.
- Yes it is indeed odd that some common 2009 stats are missing - that is because there aren't "per 40" stats available on sports reference in that year for some reason. Given more time I would pull the non "per 40" stats as well.
- Remember all of this analysis is only based on draftees from college (no high school or international players factored into any of this).
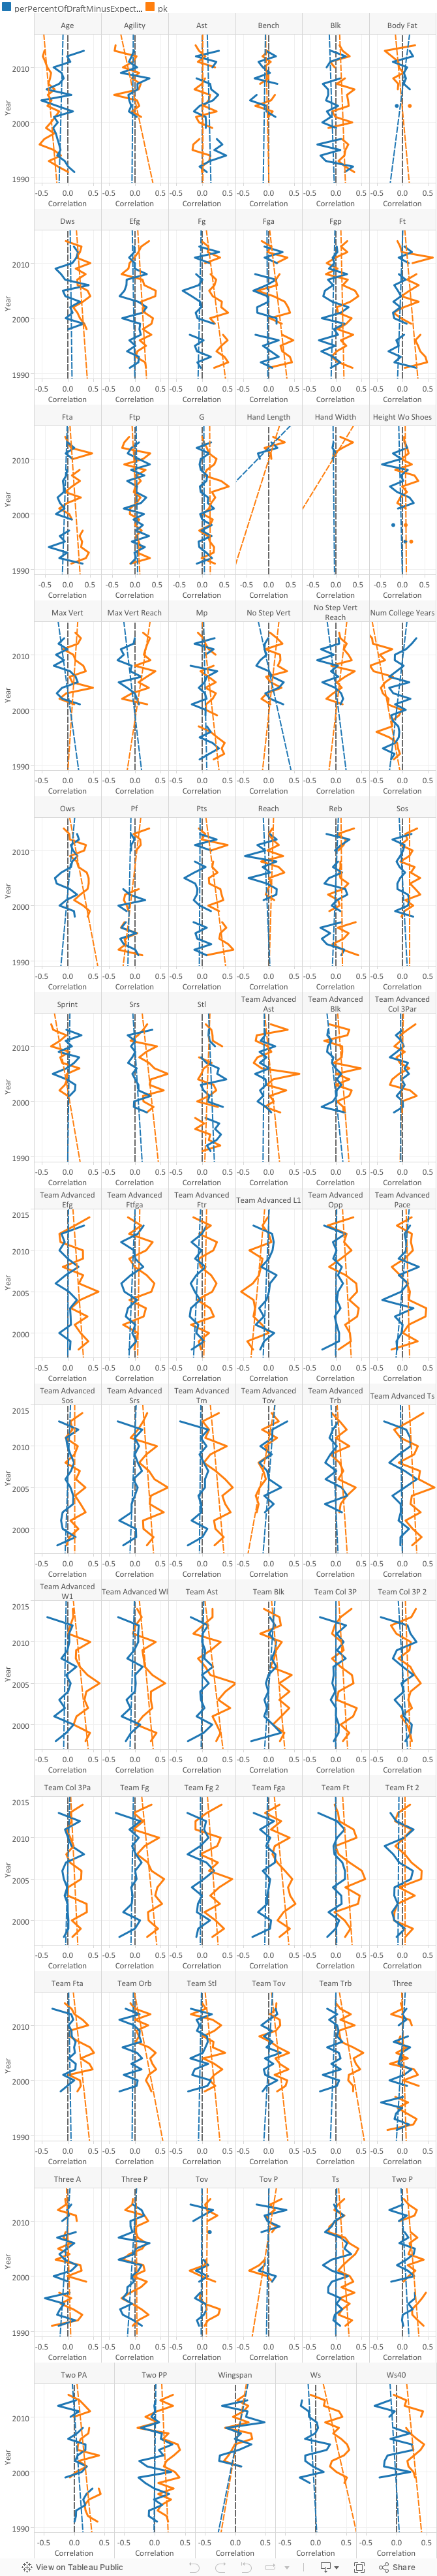
Here are some pointers for interpreting the charts:
- pk (orange line) - represents how much the attribute correlates with what number draft pick players are selected
- Positive correlation (right of zero) means that players with higher values of the attribute seem to be drafted as higher draft picks (1st pick being the highest in this case)
- Negative correlation (left of zero) means that players with higher values of this attribute seem to be drafted lower (later in the draft) perPercentOfDraftMinusExpected (blue line) - represents how much the attribute correlates with overachieving expected PERPercent (see here for more info) based on draft pick number
- Positive correlation (right of zero) means that players with higher values of this attribute seem to indicate that a player is likely to overachieve their draft pick expectations - Teams are potentially under-valuing the attribute (assuming higher is better for this attribute)
- Negative correlation (left of zero) means that players with higher values of this attribute seem to indicate that a player is likely to underachieve their draft pick expectations - Teams are potentially over-valuing the attribute (assuming higher is better for this attribute)
Analysis
I went through the correlation charts for all of the attributes I am considering and pulled out the ones which I found most interesting. For each of the interesting ones I will show the correlation chart and describe what this is showing, then I will offer some analysis on what this really means. At the end I will include all of the correlation charts if you want to do your own analysis.
Age/Num College Years
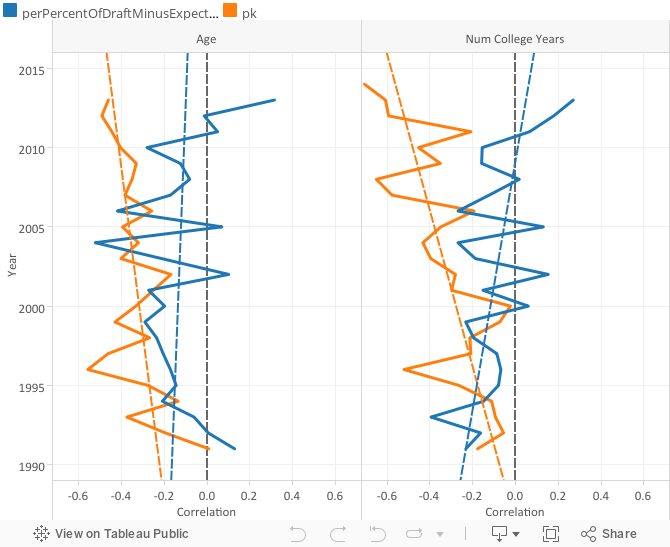
What does this show? The trends in these graphs are about as apparent as you will find. It is clear that teams are favoring younger and younger players every year. In the meantime while teams are drafting younger every year the actual performance of players "overachieving draft position" has been heading in the exact opposite direction - the correlation of older players "overachieving" has been increasing every year. Before 2011 the trend line was still on the negative side (meaning that younger players correlated better with overachieving), however since 2011 this has changed into the positive (meaning that older players were more correlated with overachieving). For both of these charts the trend lines seem to be diverging from a vertical line around .2 negative correlation. I interpret this as meaning that there is a constant "value" for younger players but as teams draft younger and younger they are over-shooting the actual "value" which results in "overvaluing" this attribute and in turn opening up market inefficiencies. In stock market terms I would compare this to a stock which starts at $50 and has a true long term value of $100, as time goes on the stock price increases and eventually it reaches the actual true equilibrium point. However with investors still riding the wave with excitement the price keeps going up above the actual value and in the short term it may continue to increase up to $110.
What does this mean? This means that there is obviously some sort of correlation between less years in college with success. In all drafts up until 2000 there was a market inefficiency in teams not valuing this enough. However since then it has been bouncing around the equilibrium point and since 2011 it appears that teams are now over-valuing younger players which is causing a market inefficiency to be introduced in the other direction. The trend lines are diverging at an astonishing rate and teams might need to start understanding that spending 3 or 4 years in college doesn't have to be such a bad thing. I do have some reservations on this though. The average draft age has without a doubt gone down over the last 10 years which could add another dimension to this attribute - it would be interesting to plot the average number of years in college for draft picks and see how that compares. Once again this could be an example where teams are intentionally taking a risk on "potential" rather than taking a seasoned college player who is more likely to have success. Also data on "overvaluing" over the last 3 years might be skewed a bit because the younger players may not have hit their potential yet compared to the older players so that needs to be considered. In summary, the trend at which teams are drafting unseasoned college freshman and sophomores doesn't appear to be sustainable. With more and more success from recent guys that are more NBA ready who stuck around for 3+ years like Damian Lilliard, Kemba Walker, and Klay Thompson teams may want to start playing it safer and going for the sure thing who is much more likely to have success.
Ast

What does this show? Assists seem to have traditionally been undervalued by teams. The only years when assists have negatively correlated more than .1 with "overachieving expected draft pick value" were 2002, 2008, and 2012. All 3 of those years has some sort of spike in how much team's picks correlated with assists compared to years just before/after. The year 2002 shows up as underachieving because #2 pick Jay Williams hugely underachieved because of his career being cut short. Similarly in 2008 Derrick Rose (#1 pick) hasn't quite lived up to some of the other players in his class because of injuries. 2012 most likely shows up because the top 4 assist players from college (Kendall Marshall, Royce White, Marquis Teague, and Tyshawn Taylor) have all underachieved their PER draft value expectations so far. One thing I find very interesting in this chart is that frequently when the "pk" correlation is positive the "perPercentOfDraftMinusExpected" is negative and vice-versa. This to me means that there is a pretty consistent value in assists and when the market is high on the attribute the players "underachieve" whereas when the value is low the players "overachieve".
What does this mean? Historically teams have undervalued assists more than they should be so in general I would put more value in them than teams have been. However the one exception might be when the teams are really high on assists - then I would avoid overvaluing in those years. 2014 looks to be a year where teams are lower on assists so I'm guessing that it will be a year when we will see some of these guys overachieve who are good in this attribute.
Hand length/Hand width

What does this show? There isn't a whole lot of data here to be too significant, however these are both very interesting to look at. From 2010 to 2012 the highest correlation between draft pick and hand length/hand width was in 2012 for hand width when it had a value of .145. The next highest value in that time period for either attribute was .052. However in 2013 hand length had a correlation of .354 and hand width a value of .382. These are actually pretty significant when you look at other attribute values. After such a dramatic increase some people might ask: "what changed?" Well 2012 is right about when 2011 draftee Kawhi Leonard started to show signs of breaking out. Similarly it became quite well publicized that Rajon Rondo also has some big mitts on him. Here is an ESPN commercial from early 2013 showing his freakishly large hands. It appears as though teams have started to think that hand size could lead to finding the next hidden gem like Rondo/Leonard (both big time PERPercent overachievers) and have been drafting accordingly. Guys from the 2013 draft class who showed larger hand sizes were: Steven Adams, Alex Len, Shabazz Muhammad, and Nerlens Noel (all top 14 picks). Adams showed some promise in his rookie season, however the jury is still out on the rest of these guys and so far Len and Shabazz look more like busts than stars. It's hard to say if having big hands contributed to all of these guys with big hands getting drafted so high or if it was a coincidence and they would have been picked this high regardless. Similarly I wonder if they would have dropped in the draft more if Rondo/Leonard haven't had the success they have. Regardless it is hard to ignore the drastic change in that graph! Data from 2014 dropped down quite a bit from 2013 but it is still quite a bit higher than where it was previously.
Since it appears that teams out of nowhere started to believe hand size is an important indicator, you would think that in prior years these attributes would have shown up as an "undervalued indicators". However the exact opposite is true. These had basically zero correlation with "overachieving draft pick value". Actually 4 of the 6 data points from 2010-2012 showed a slight negative correlation with success! All of this shows that there was a perceived market inefficiency for "big hands", however the data never actually indicated it existed! Now it appears the market has "corrected" to properly take into account hand size when it fact it didn't need to!
I do want to point out that the 2013 draftees did appear to have this "big hand bias" and so far there isn't a negative correlation with "overachieving" which might mean something (pointing to them getting drafted this high for other reasons). It is still too early to tell for most of them but if that does hold true then teams might not be overvaluing as much as I am hinting at.
What does this mean? The market might be overvaluing hand size more than it should be which would be a market inefficiency in itself. If I were an NBA team I would be very careful to not reach for a player just because of his hand size. I would ignore any draft board who has a player listed at his particular spot because of his hand size. His true value is probably much lower and using the consensus draft ranking is going to cause you to overvalue him. Similarly I wouldn't overlook players with small hand size when other teams might. In the short term I might take advantage of this potential inefficiency by looking for players with smaller hands who are being overlooked by others and there might be a steal in that group. Rather than reaching for the next Rondo or Leonard, I would take a gamble on the next Greivis Vasquez, Kemba Walker, Michael Carter-Williams, or Chandler Parsons. All of these guys ranked in the bottom 10% in hand length from all of the combine data I have and yet they all managed to way overachieve their PERPercent expected draft value.
Max Vert Reach/No Step Vert

What does this show? By looking at the trend lines it is very obvious that teams have been valuing a players vertical more and more every year. This is especially evident in "Max Vert Reach". This is likely because everyone's models show that vertical is a strong indicator for success and potential and teams are using analytics to uncover this more and more each year. However as you can see, the more teams value this the more and more it has had a negative correlation with long-term success. In the early 2000's both measurements for vertical were a strong indicator for "overachieving". However since 2006 neither vertical measurements have had a positive correlation of "overachieving"! If you look at no step vertical you can see from 2001-2006 that only 2003 had a negative "overachieve" value whereas since 2006 not a single year has had a positive value!
What does this mean? The value teams place in a players vertical has been on the incline for almost a decade. 2014 seems to show a slight retreat from the trend line, it isn't yet clear if this is reverse "to the mean" or just an outlier. We shall see. However this is an attribute that is clearly one to watch out for in terms of a market inefficiency. It already appears like there exists an inefficiency (in it being overvalued) and if the trends continue the way they have been it could become an inefficiency ripe for the taking. Note that this could be one of those attributes which teams are intentionally overvaluing in hopes of turning a high jumping freak of an athlete into someone with "star power". In addition, high verticals mean more sportscenter dunks which helps put fans in the seats. However, in the NBA it's all about the rings so be on the lookout for some smart team putting together a very unexciting but winning team full of Zach Randolph's.
OWS

What does this show? Offensive win shares used to be hugely important in determining where a player gets drafted. This has been on a consistent downward trend since 1998 (the first year I have data on this). Note that the term win shares didn't even exist back then so it was actually more about what win shares represented more than the actual statistic itself. The class of 2014 is the first class where OWS has actually had a negative correlation with draft pick. The reason OWS correlation has been steadily dropping is because there was a market inefficiency in overvaluing offense. Teams realized this and have been adjusting more and more every year. Scouting is getting more thorough and statistics on players are getting more advanced beyond traditional box scores stats and these things have resulted in less focus on purely offense. The data is showing that OWS was regularly "overvalued" up until the year 2007. Ever since then it has actually shifted in the other direction with it showing up as "undervalued" as it has been factoring into draft position less and less.
What does this mean? Teams have been getting smarter and smarter over the years. Scoring has been recognized as only half the game with defense now being recognized as just as important. Similarly, teams are relying on other advanced stats to influence draft decisions. However since 2007 it is as though teams are actually being too smart for their own good. The data is saying that they have been overlooking something which used to be the most important part of the game in favor of things which don't actually translate to as much to success. It appears that more data is causing teams to be dumber in this case! This sounds a lot like "analysis paralysis" and teams need to make sure they don't lose focus on the basics. To take a quote from Einstein: "Models should be as simple as possible, but not more so." If Einstein were a present day basketball fan he might also have commented on teams needing to make sure something as fundamentally simple to the game like OWS is not overlooked in their models.
Sprint

What does this show? Sprint speed has had an increasing negative correlation with how NBA teams are drafting. Since this is a "negative value" this means that teams are favoring players with lower speed numbers i.e. faster. The numbers fluctuate quite a bit but by looking at the trend line for how much this is undervalued it is trending up as being overvalued. This sounds a lot like what happened to the NFL - the game has become faster and faster - where over the last decade the game of football has been frequently associated with the phrase: "speed kills".
The Oakland Raiders and others have been reaching on players every single year who show exceptional 40 speed for this reason. For example the Raiders have been focusing on drafting speed at CB and WR whenever possible. They have selected 5 of the 10 fastest players 40 times in combine history. Meanwhile the Seahawks have been overlooking CB's speed for other intangibles (read more about this here). Instead of reaching on players with speed the Seahawks have went after tall corners who can blanket other teams fast receivers with their length and strength. Similarly with height the Hawks have been filling their WR core with a bunch of "pedestrian" guys who were not thought highly and frequently because of a lack of height. The former Seahawk Golden Tate is a great example of this. He was a late 2nd round draft pick and many scouts doubted him because of his 5'10" stature. However the Seahawks knew he had a certain swagger about him and that could play at the NFL level which was evident in one of the most epic Monday Night Football finishes ever seen. I don't agree with the call from that game or condone his post game interview but as a Seahawks fan I couldn't help but appreciate his play-making ability on that play as well as the other big time NFL plays leading up to that embarrassing moment for the infamous replacement officials. Tate may not have exceptional height (and you may not like his personality) but he is without doubt a NFL caliber receiver.
What does this mean? In short, sprint speed is becoming overvalued in the NBA. I think the NBA should learn a lesson from the NFL here. Speed has without a doubt been one of the most overvalued attributes in the NFL draft. It appears that it is starting to become this way in the NBA. NBA teams - unless you want to look like the NBA's version of the NFL's Raiders then I would ignore a players overvalued sprint speed and look for other intangibles similar to what the Seahawks have done. To take a quote from myself: "basketball is more about quick movements (i.e. quickness and agility) and body control and not necessarily straight line running speed (unless you are Russell Westbrook on a fast break with no fear for anything in his path)". Therefore I don't even think NBA teams should be considering sprint speed unless the player is literally too slow to get up and down the court. Instead focus on what is actually important for success in the NBA.
Stl

What does this show? Steals has consistently shown up as an "undervalued" indicator for long-term success which was very evident in my previous analysis. Steals have had a positive correlation with "overachieving" in all but 2 season which I have data for. Even in those two seasons it was barely negative and not significant. Meanwhile teams have been slowly picking up on this a bit with steals showing a positive trend of influencing draft position as time goes on.
What does this mean? Even with more recent trends of NBA teams using steals as an indicator more and more it seems there is still an overall market inefficiency here. I wonder if some NBA teams are behind others in this category? I want to take a look at team adoption on things like this in a future post.
Team Losses

What does this show? There is a strong decrease in negative correlation of a the number of losses a players college team had and his draft position but it is still negatively correlated. That was a mouthful - in simple terms this mean that teams used to not draft players from crappy college teams whereas now that is less true. How this change in behavior actually translates to under/over performing is not clear as the "perPercentOfDraftMinusExpected" results are all over the place. The year 2013 seemed to indicate this was a bad change in behavior, however this hasn't been consistently true.
What does this mean? Teams are not just picking from the elite teams anymore. Teams are looking beyond just the Duke's and Kentucky's. This makes sense as mid majors are getting more exposure and scouting/visibility is becoming more thorough across the nation. However the data is not conclusive on whether or not this is resulting in better/worse draft decisions. Time will tell on this one.
Wingspan

What does this show? The data fluctuates a lot here but in general it appears as though teams are considering wingspan more and more (shown by positive to negative "pk" correlation) while at the same time it has went from being a positive indicator for overachieving to more so now being a negative indicator.
What does this mean? I don't have much to add here more than what I talked about in in regards to "vertical" analysis. It seems that teams are valuing wingspan more and more (although a bit less consistently) and it is now at a point where wingspan seems to be overvalued to an extent. One interesting thing to point out is that the patterns seem to be mirroring "zero" which would indicate that this attribute doesn't truly correlate with success or not and whether or not it is over/under valued is purely dependent on how much teams are under/over valuing. I wonder if relation to height or position matters here - I bet this would be interesting when looking at more advanced relationship correlation involving multiple variables.
Win Shares

What does this show? Win shares (Ws) have become less and less important in influencing draft pick. Correlation of win shares and overachieving has become more and more over this same time period.
What does this mean? This sounds identical to OWS. Remember that the Ws calculation factors in OWS so that makes sense. The conclusion on OWS was that teams are starting to overlook the statistics which represent OWS more than they should be in favor of other indicators as more data is available. I am surprised by strictly win shares showing up in this way like OWS since win shares does consider defensive value. In my OWS analysis I thought it could be because defense has been looked at as more valuable but since regular win shares shows up in the same way that means that it might be more about non-traditional indicators (combine data?) being looked at as more important. One thing I will add is that this could also be influenced by the trends of younger and younger players being drafted higher and higher - younger players may not be putting up the same kinds of OWS or win share numbers in college but yet teams are drafting them high anyway because of potential.
Conclusions
As I expected, in the charts above you can clearly see some visible changes in trends over the years. In the interesting charts I analyzed I saw three clear themes:
- Overreacting to hot new trends (hand size, vertical, sprint, wingspan, age)
- Less focus on more fundamental attributes as new data is introduced (OWS, WS)
- Historically overlooked stats (AST, STL)
Based on this, unless you are able to consistently see the hot new trends before/as they are happening I would urge teams to not lose sight of the basics and to be careful to not overvalue what is trending and instead take advantage of the market inefficiency that other teams are introducing.
Potential future articles
- Which 2014 draftees are most impacted by these observations?
- Are certain teams lagging behind in these market inefficiency changes?
Reference Charts
Here are charts for all of the attributes including the ones I didn't analyze: