What team best defends the Spurs?
Introducing shot charts, with a twist
There are a number of shot chart tools out there, highlighted by Kirk Goldsberry's work at Grandland, Austin Clemens' shot charts, Vorped, and the NBA Stats site. A few of them show defensive shot charts, and Goldsberry recently had a Grandland feature on player defensive shot charts made possible by the ever elusive SportVU data which will be discussed at Sloan a few days from now.
While these are all great, and their data quality is significantly better than my current dataset, the community seemingly lacked a generic library to create beautiful shot charts that could be used as a basis of further visualizations. So I decided to enter the fray, mainly as an elaborate test case for open sourcing a shot chart library, and the results can be viewed in our new tool, Shot Charts. There are shot charts for teams, players, and top 5 man units on the offensive and defensive side of the ball. Each chart also includes nifty shotcuts to find the teams, players, and 5 man units that best attack it.
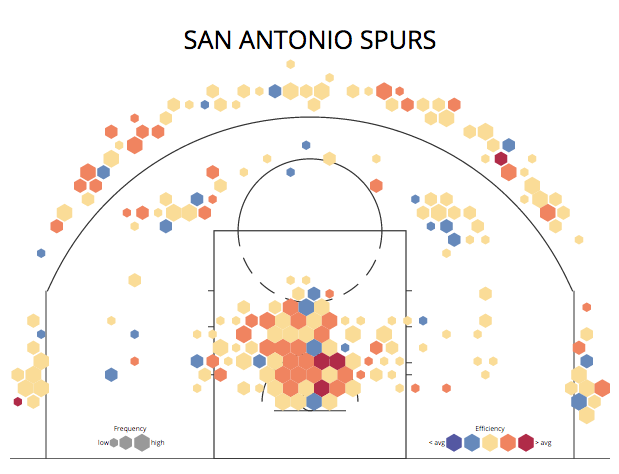
To give an example, here is the Spurs' offensive shot chart for the 2013-14 campaign:
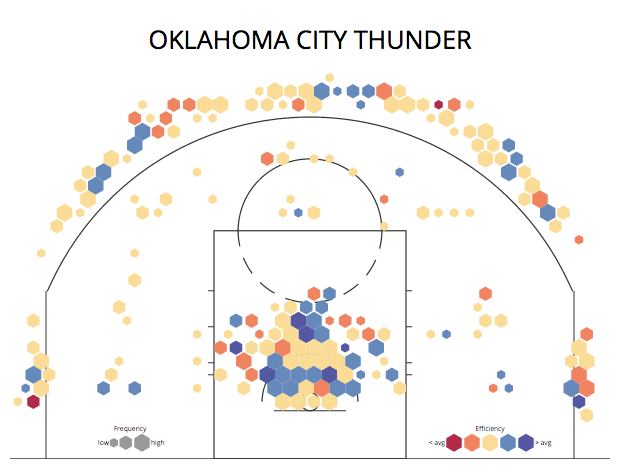
And here's their #2 best opponent from a team defense perspective, Oklahoma City, who just happened to beat them in all 4 regular season matchups:
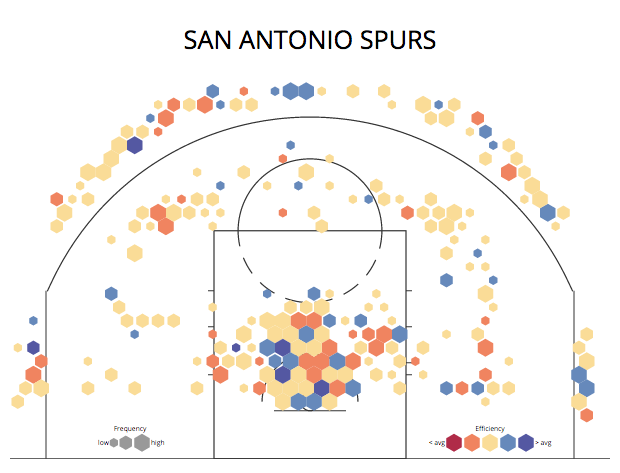
Of course, San Antonio had the final word in the conference finals, and that's because their defense:
Which was one of the top team defense opponents of the Oklahoma City offense:
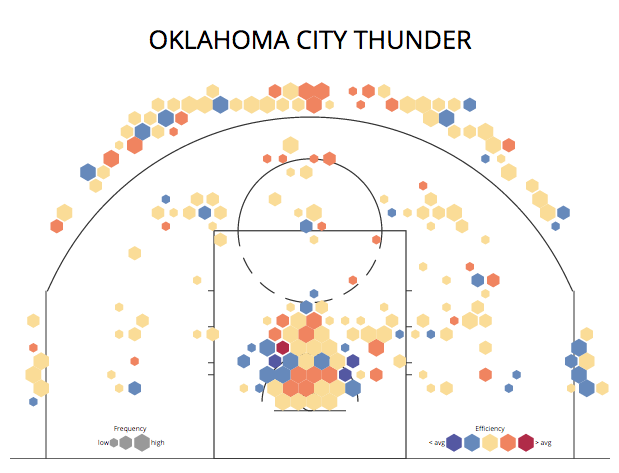
Also, both these teams were in the top 5 of defensive rating last year, so this is mostly anecdotal value, but there are interesting bits like the Pistons being one of the top defensive opponents of the Heat last year and stealing a game of that series. Either way, I hope someone finds this useful, and at the very least, pretty.
For posterity, I thought I'd mention some improvements that will follow:
- Open sourcing the d3 visualization (coming in the next few days)
- Enable saving as visaulizations as images
- Current season data (coming in the next few weeks)
- More granular data and data smoothing to create more visually pleasing shot charts