Anyone who has analyzed historical NBA draft picks should know that translating college success to the NBA is never a sure thing. No matter how good the scout, GM, or draft model, there is still a high level of uncertainty involved in predicting NBA success.
My goal is to highlight this uncertainty. By putting less emphasis on a single number, and more emphasis on the range of outcomes, our evaluation of players can be more representative of the roll of the dice that NBA teams actually face.
To learn more - see last years draft model blog post. If you just want to see the results then skip ahead to 2019 rankings!
Modeling Details
Data
The biggest improvement to this years draft model is that it utilizes innovative statistics that can't be found anywhere else including: Bayesian Adjusted RAPM, "Actual" Advanced Stats, and Player Impact Stats. These stats isolate the true impact of a player controlling for efficiency (minutes), level of competition (opponent), and situation (team). Other inputs also include scouting (high school ranking) and player characteristics (age, height, weight, combine).
Quant Model
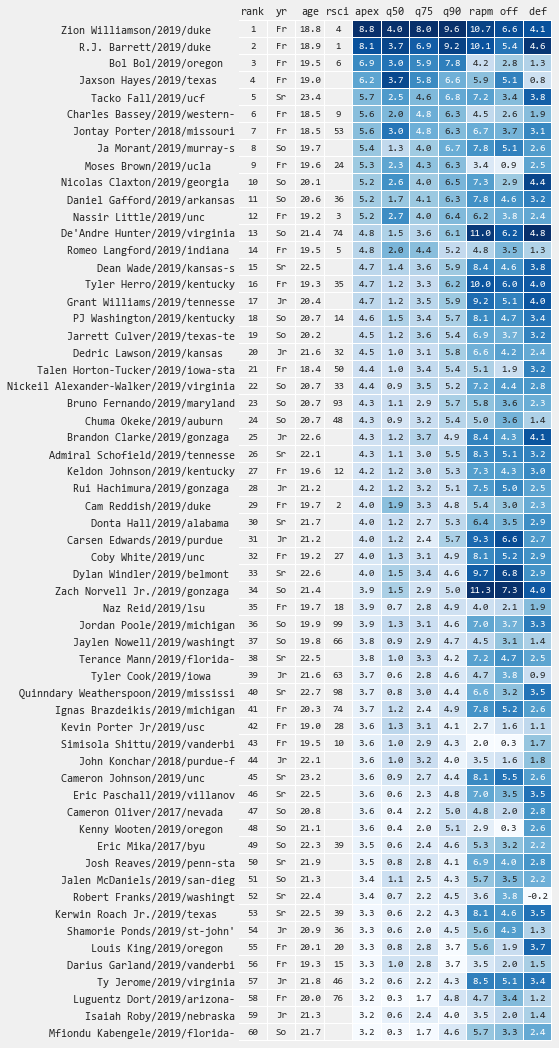
Quant is a gradient boosting quantile regression model which predicts a players NBA peak single season win shares. By using a quantile regression model, it allows you to evaluate predictions across quantiles, highlighting differences in risk and upside. By looking at the 50th, 75th, and 90th percentile outcomes for a player we can see which players have a lower floor (q50) versus higher upside (q90).
APEX Model
While I recommend focusing on the full spectrum of Quant outcomes, I realize there are times when a single number is unavoidable (i.e. draft board rank). Therefore, APEX is a single number interpretation of Quant. Given that star players are so important in the NBA, APEX is calculated by averaging the higher upside outcomes (q75 and q90). In cases where a player has multiple season's worth of pre-NBA data, the players overall APEX value is a minute weighted average of all APEX values.
Star Model
Star is a classification model which predicts the probability of being an All Star (star), Starter (start), Role Player (role), or Bust (bust).3 The advantage of the Star model is that the results are intuitive, however keep in mind that being a Starter or Role Player in the NBA is sometimes about situation and does not imply success or efficiency (which is what is captured in the Quant model).
Comps
To give insight into playing style and NBA combine comparables, I have a K-nearest neighbor model which shows historical players that are most similar.
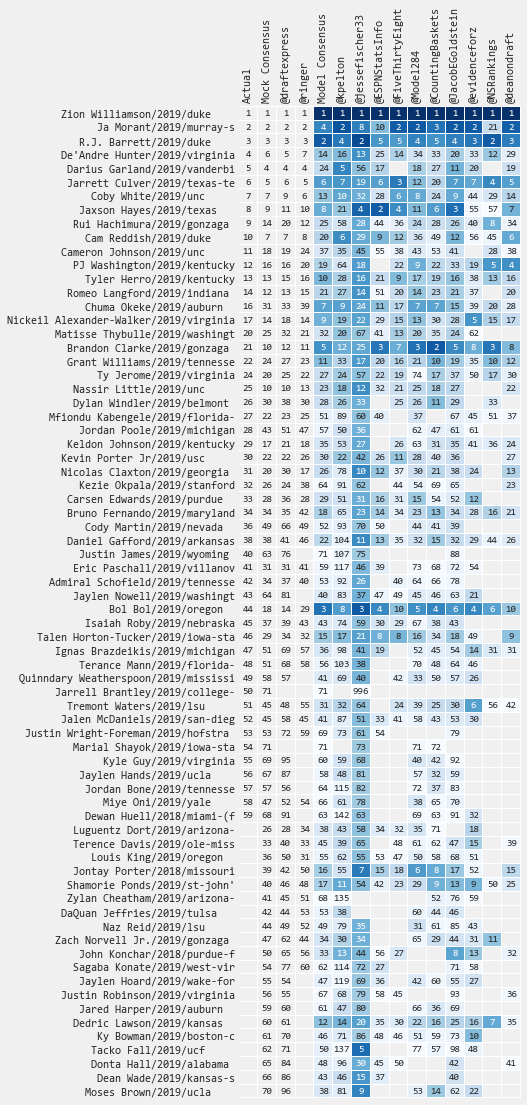
2019 Rankings
Top 60
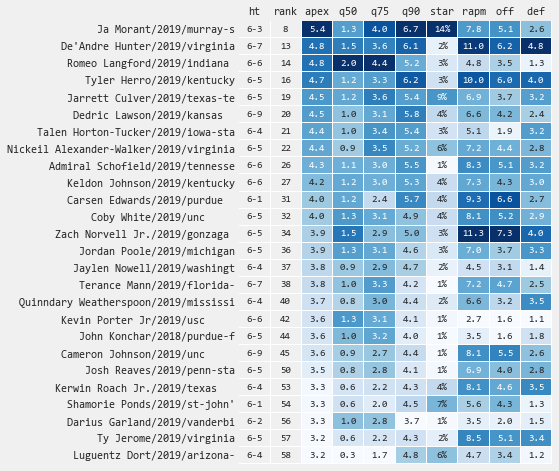
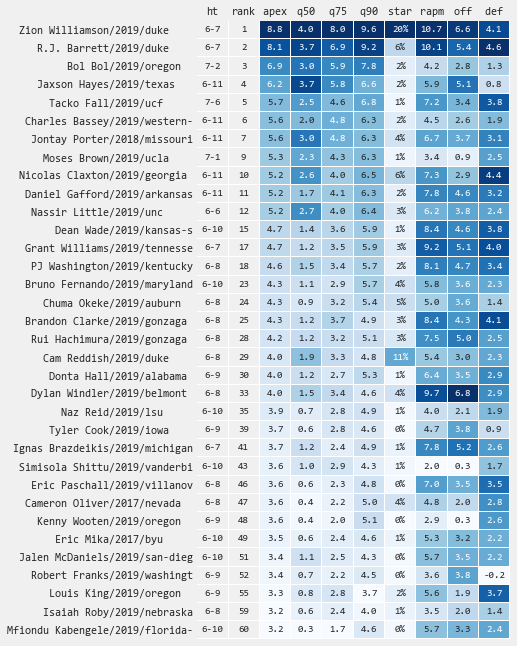
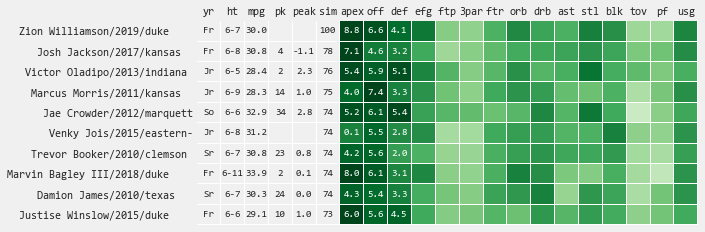
Guards
Below are the top Guards - a statistical profile view can be found here.
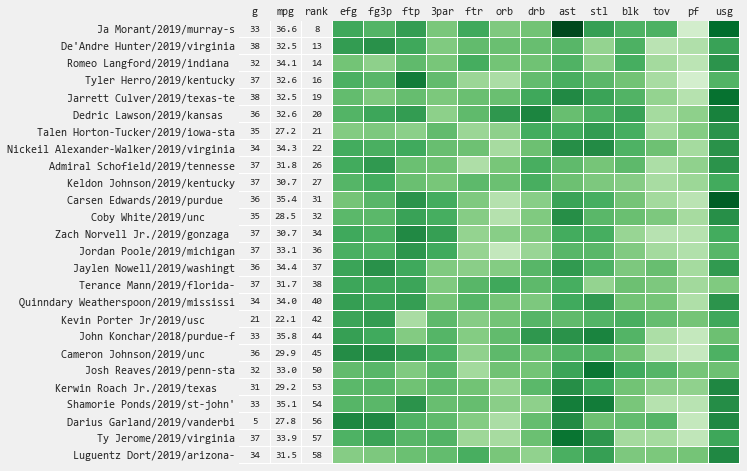
Bigs
Below are the top Bigs - a statistical profile view can be found here.
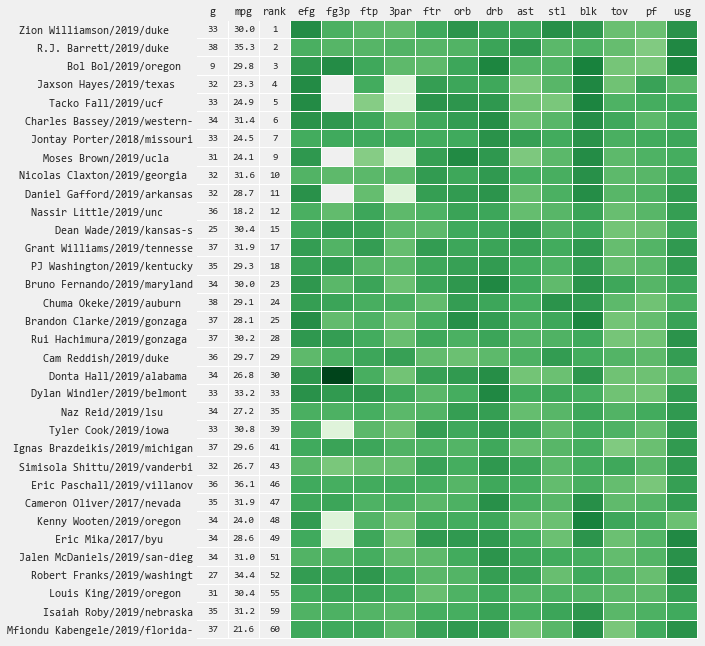
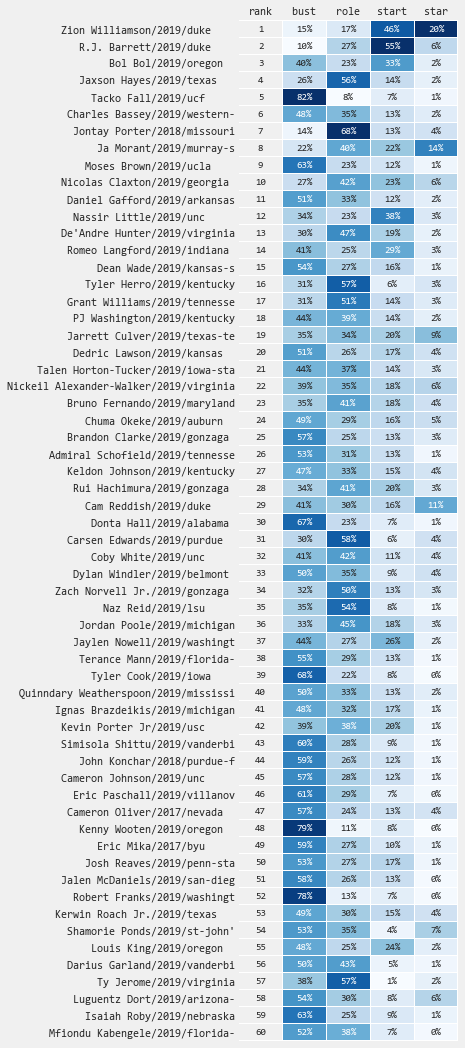
Star Model
Player Profiles
Select a player to see a players draft profile including:
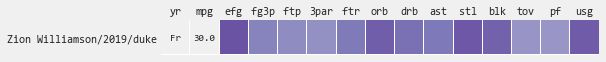
- Statistical Profile - visualize the strengths, weaknesses, and growth trajectory of individual players over their college careers
- Playing Style Comps - find the most similar player seasons compared to the potential draftees most recent season, which can keep you honest on a players expected outcome
Zion Williamson
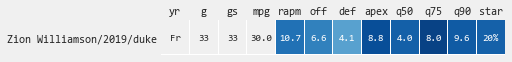
Statistical Profile
Playing Style Comps
Draft Model Comparison
Glossary
- q50 = Predicted 50th percentile outcome
- q75 = Predicted 75th percentile outcome
- q90 = Predicted 90th percentile outcome
- apex = Average of q75 and q90
- rsci = High School Rank
- star = NBA All Star probability
- start = NBA Starter probability (starter for >60 NBA games in a season)
- role = NBA Role Player probability (played in >60 NBA games in a season)
- bust = NBA Bust probability
- ht = Height
- wt = Weight
- gs = Games Started
- gp = Games Played
- mpg = Minutes Per Game
- ts = True Shooting Percentage
- efg = Effective Field Goal Percentage
- 3par = 3 Point Attempt Rate
- ftr = Free Throw Rate
- usg = Usage Rate
- pk = NBA Draft Pick
- sim = Player Similarity
- The definition of All Star is self-explanatory, whereas I arbitrarily defined Starter as having started 60 games in a NBA season, Role Player as having played 60 games in a NBA season, and Bust as everyone else.↩