How has height changed over time in the NBA?
An exploratory look into the changes of height, and weight, distribution over time in the NBA
Some background
Sometime last June, there was an SI article1 that did some analysis and came up with an estimate that 17% of all males over 7ft in the US were in the NBA, which was then reported here, here, and everywhere.
Around that time, I wrote down a question on my neverending list of questions to do analysis on: How much is it worth to be tall?
Unfortunately, this post won't contain the answer to that question, but in researching, I came up with enough interesting2 info for a multi-part post, beginning with some exploration of NBA player heights throughout the League's existance.
A brief overview
As you probably know, Americans have generally become taller and larger over time, although we may be shrinking due to our unfortunate dietary habits. Like most populations, you'd be right to assume heights are fairly normally distributed.
If we take a look at NBA player height distributions over time, they also seem to mostly reflect a normal distribution early on in the league, only to start to become a little more biased towards taller folks:
Some notes if you're paying close attention:
- Its more than possible I'm missing data from the first decade of the league 3
- The average height starts off ~6'3 at the beggining of the league, and works its way up to 6'5 by the end of the 50's, and gradually rises to stay steady at 6'7
- The distribution median starts to shift right to 6'8 while the average height rose to 6'7
- The change in average height outpaces the average height in the normal US male population4
Diving deeper
Looking at these distributions, we can tell there's mostly a gradual change to the general distributions of player heights today, but I figured we could see if the distributions were actually from the same populations using a Kolmogorov–Smirnov test test to see if two continuous distributions were related. Unfortunately, because of the number of ties, the pvalue from such a test wouldn't be accurate, so I instead used a modified version that allows ties in Bootstrap Kolmogorov-Smirnov.
Comparing a season with its prior season's height distribution, here were the seasons where we are not at least 80% confident they're related (e.g. they come from the same distribution as the previous season):
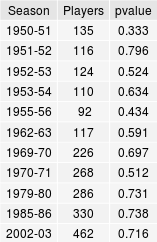
Given the state of the league in its infancy, and previously cited concerns over data integrity from that era, I decided not to dig into those years to figure out what the change may have been. With the average career length being about 5.5 years5, and our observation that the general distribution seem to level off in the late 80s, its not terribly surprising that we get a shift in the distribution from 1956 to the 1986 season every 6-7 years. Still, digging in to each of the remaining seasons, we can compare the season before and after to see if they were all blips, and indeed they all are, or at least they weren't the beginning of a new trend.
Looking at this from another angle, we can look at all seasons, and compare them to a season n seasons before. From here, we might be able to at least determine how many years need to go by before heights in the league are distinctly different. Interestingly, but probably not surprisingly, it has slowed over time. Let's look at the changes over decades.
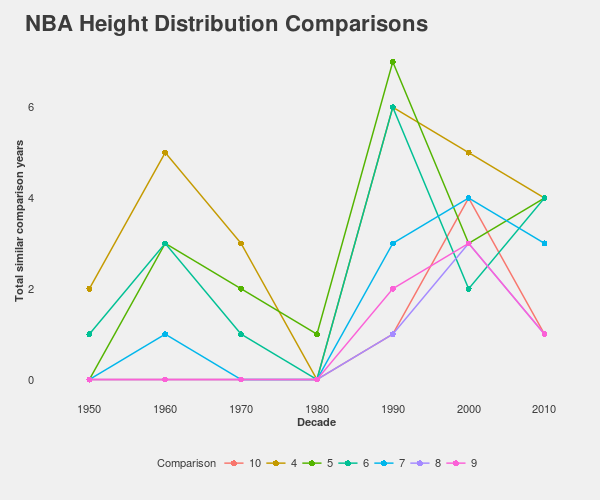
This is an admittedly tough plot to grok, but each data point represents how many years of that decade were similar to past years they were compared against (using the same 80% confident criteria), and each line represents various values of n (or how many years prior to the season we're using in our comparison). From this plot, we can tell that even from the 1950s, it took about 7 years (probably 6 because the early 1960s compared to some funkier data of the mid 1950s) before the height distribution was completely different, and this trend lasted until the 90s. From there it took about 10 years before the distribution was distinct until the 2000s. From here, interestingly, we can see that the height distribution in the NBA has generally been constant for the last 20 years or so. Until this decade is out, its difficult to tell, but the increase of analytics over the last decade might indicate a new shift in height distribution as teams become more selective of their personnel.
Looking at weight
While conducting this research, I realized it'd be pretty easy to view the changes to weight over time, and its surprisingly interesting:
Things that jumped out at me:
- People were significantly smaller when the league started!
- The average weight goes from 175 in the early days to 200 by the end of the 50s. This tends to stay constant until the 80s and 90s where we see the average weight rise to about 220 and basically set the new norm.
- Percentage wise, the shift to modern basketball player is proportionally better represented by weight.
Coming up…
In my next post, I'll be looking into whether we're overvaluing height from a basketball contribution perspective.
Source: Basketball-Reference
-
The SI Vault is indeed crappy to search through these days. ↩
-
My definition of interesting is very likely to differ from yours, normal person. ↩
-
All data is from basketball-reference.com, which may be lacking some data from the early years of the League. But there's also 15 franchises that foldeed which probably accounts for some of the weird fluctations in total population. ↩
-
This is likely due to the rising popularity of the sport, and probably more importantly, increasing wages that made it more appealing than being an insurance salesman. ↩
-
As calculated by the same dataset used in this analysis ↩