As I mentioned previously I thought it would be fun to create a money line model to provide some suggestions for best money line plays. This is in addition to existing ATS and O/U models introduced.
This new money line model works by building the win probability for each team/game and then comparing it to the Vegas payout for each team to see the best opportunities relative to payout. Since the tourney is almost over I'm a little late to the game to suggest bet opportunities but it is still interesting to see how it would have done (and maybe bring it back next year!).
Before I share some results I want to point out that money line betting is a difficult thing to do. It sounds fun because of the multipliers but in order to have consistent return betting on sports you have to go after realistic plays and not necessarily the long shots. Also keep in mind that what I might be calling a "good" bet is mostly suggesting the bet is being undervalued relative to win probability, it doesn't necessarily mean that that it has a good chance of winning (as the probability may still be low).
Probability
First, let's look at my win probabilities and see how they compare to fivethirtyeight's across all games in the tourney:
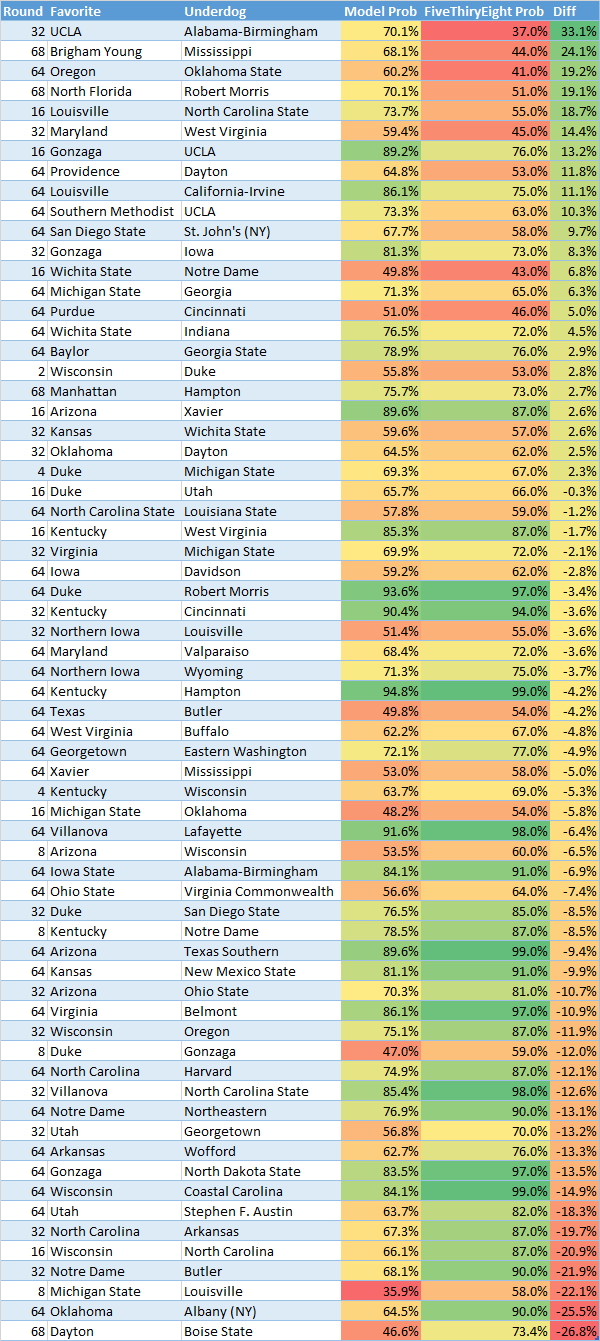
The correlation between the two is .716. It is interesting to look at which games the models differed the most. Some of it is because my model doesn't account for the same things: travel (Dayton), "player absences" (Louisville), etc. My model also generally has lower win probabilities for "big favorites". They also differ greatly on various teams (my model likes the Zags a lot more but Utah a lot less). From the eye test my probabilities seem reasonable but they might be lacking some info and may not calibrated properly on large spreads.
Results
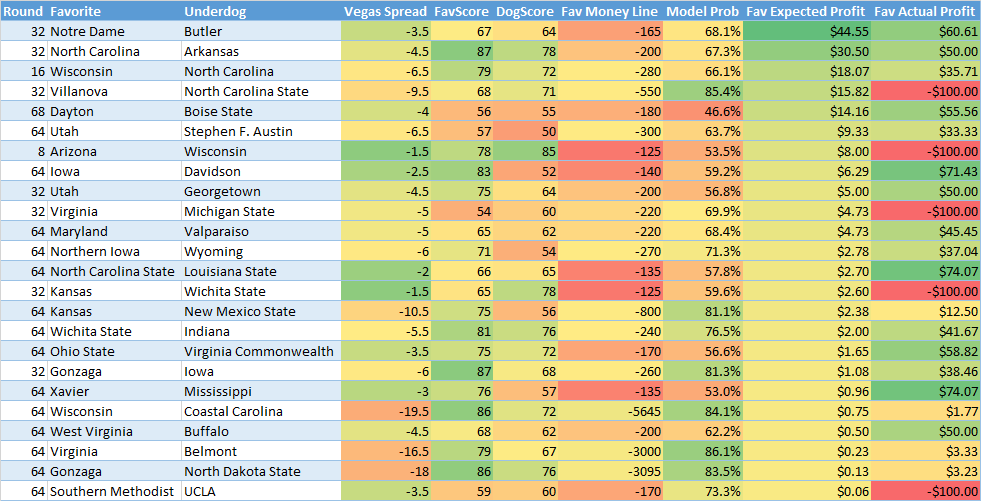
Now let's look at some results. There is a lot going on in these charts below but the most important columns to look are the last two. The "expected profit" column represents the expected value1 of the associated money line bet given the win probability and Vegas payout2. The last column is the actual profit you would have made on the given bet (since we are doing this after the fact).
In the first chart we only look at data for the "favorites":
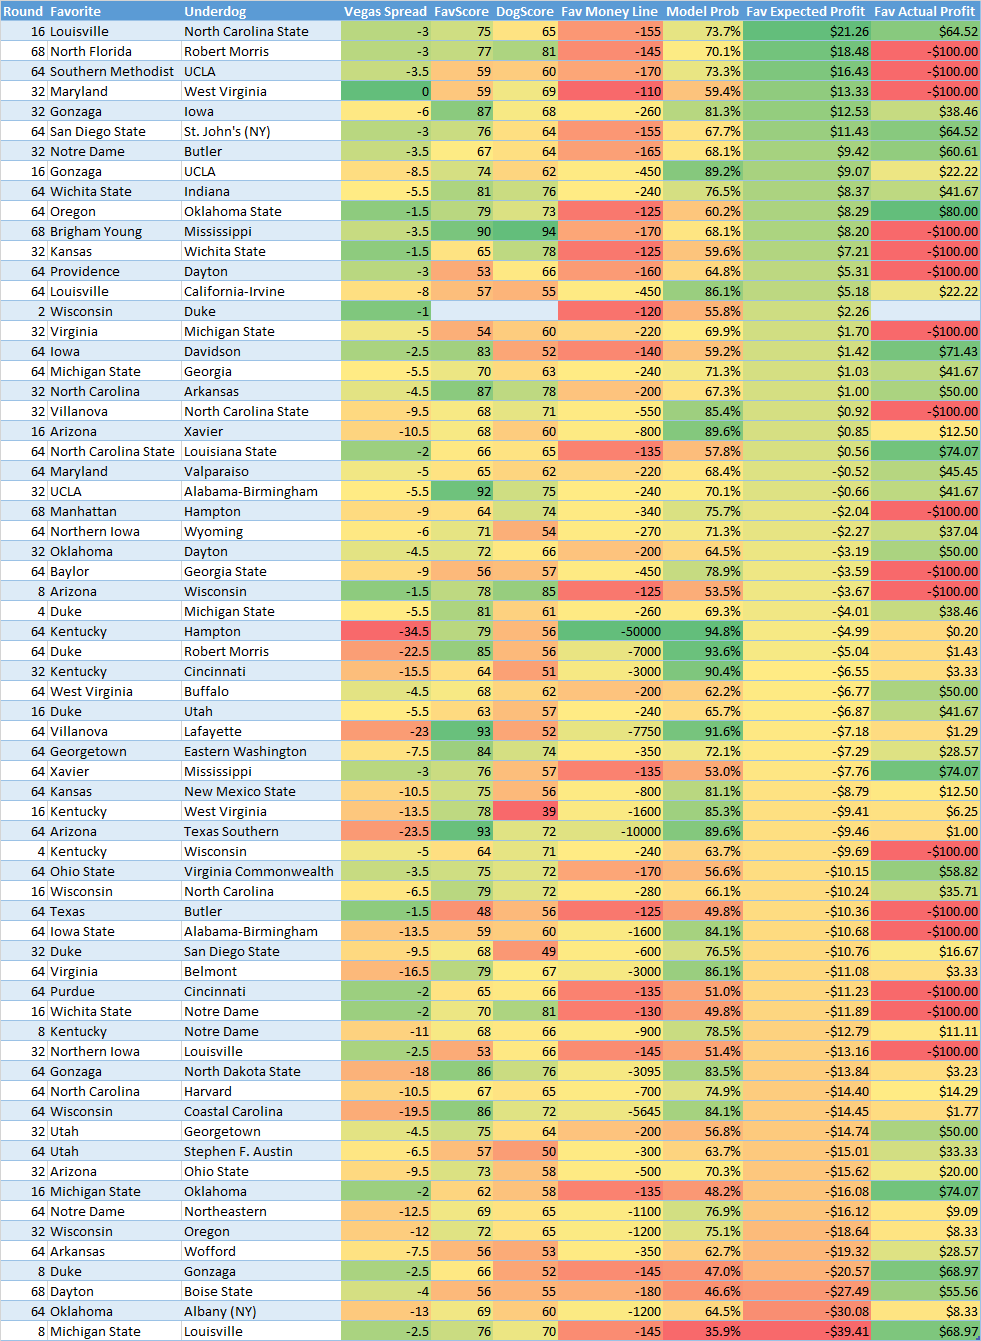
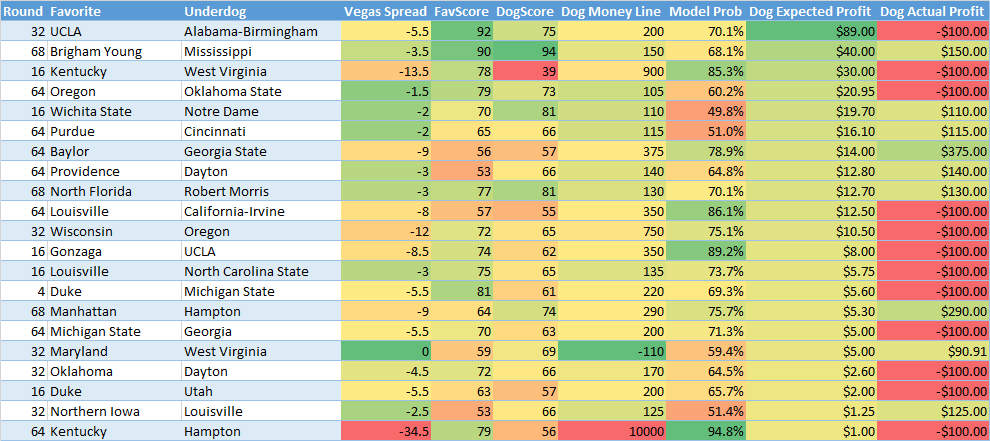
As you can see it does pick the favorites well in expected positive profit matchups (13-8). However you can't make money betting on favorites without a higher win percentage, as those bets would have resulted in a net loss of -$156. Favorites don't pay out in Vegas. In the second chart we can see the same results for "underdogs":
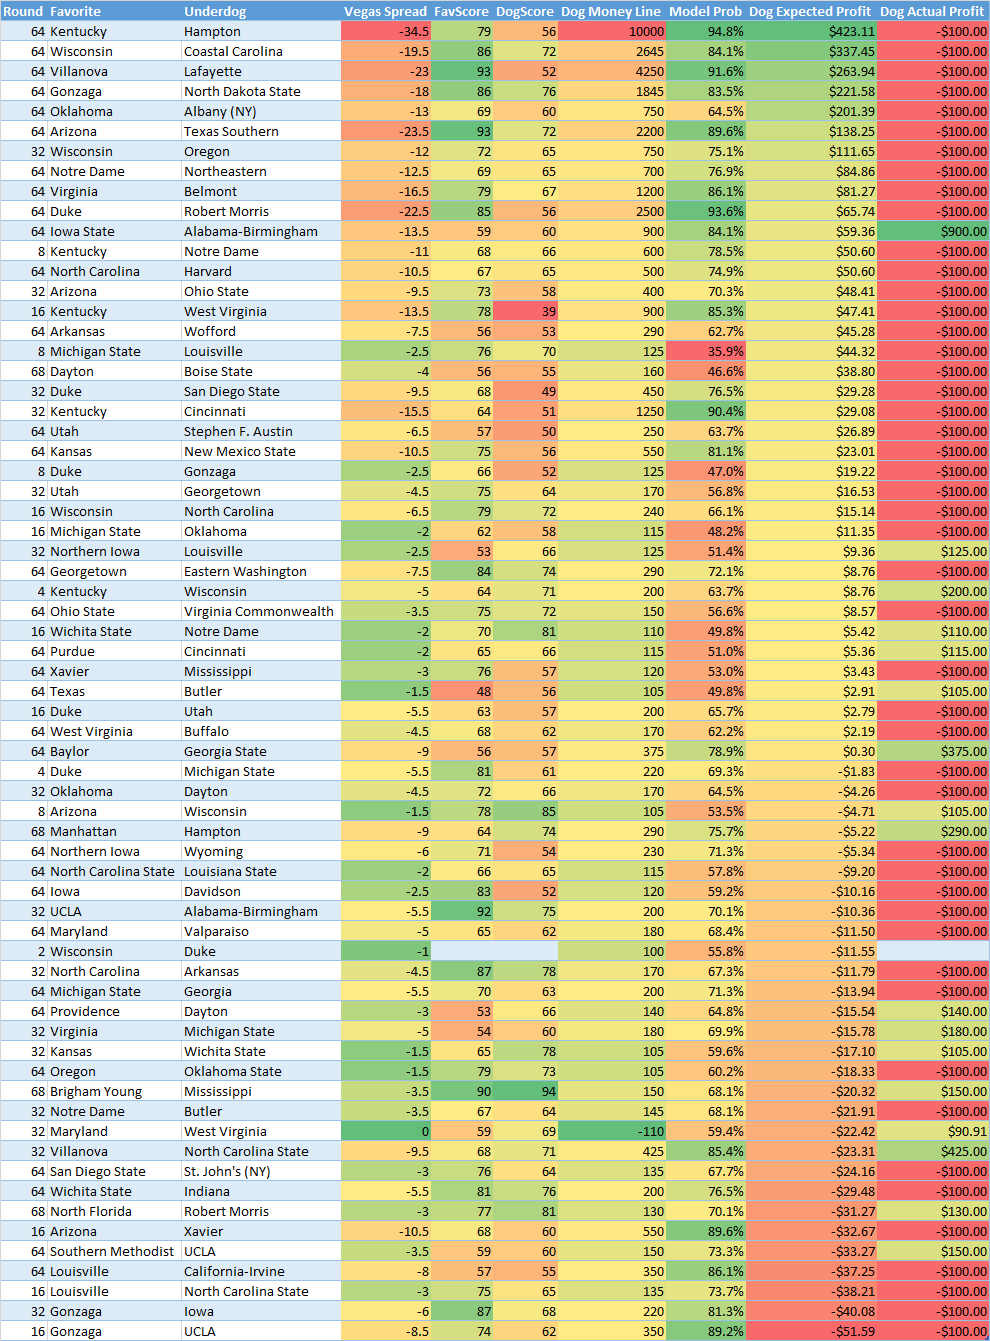
Based on the number of large spreads showing up at the top it appears my model is undervaluing large favorites probability compared to Vegas. This was also observed above when comparing with fivethirtyeight's numbers. If you would have bet on all "expected profit" underdogs you would have went 7-30. This sounds bad but it might not be so bad if you picked all the upsets which had good payouts. However that wasn't necessarily the case as these bets would have resulted in a net loss of -$1,070. If you look closely at the bets with lower (but still positive) expected winnings they actually did fairly well. Now how about we only look at matchups where the favorite was expected to win by less than 60% probability:
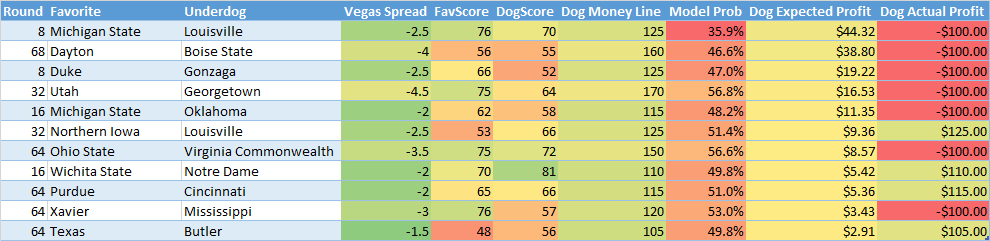
After limiting to only the games which are "more likely" for the underdog to win we can see our record improves quite a bit to 4-7. However even then the Vegas payout isn't enough to make money as the overall net loss would have ended up being -$645.
Well, it sounded good in theory but without some more work it doesn't sound like the model is good enough to bet money lines (at least given the results on this small dataset). To see if it was a matter of my model not being good enough or it just being too hard to bet money lines given the Vegas odds I ran through this same process on the fivethirtyeight numbers.
Fivethiryeight Results
Well…it turns out their model must be better than mine because they would have made a profit on both the "expected positive" favorites and underdogs.
Here you can see that expected positive favorites would have went 19-5 for a profit of $2973:
Here you can see that expected positive underdogs would have went 9-12 for a profit of $326:
Not bad. It isn't significant but it's in the green! Looks like I have some work to do to improve my models…Until then maybe I'll use fivethirtyeight's…
-
This is the expected net profit on a $100 bet ↩
-
As represented by a snapshot in time when I looked at Vegas insider ↩
-
Remember this is $100 bets on every game ↩